HSBC 2002 Annual Report Download - page 217
Download and view the complete annual report
Please find page 217 of the 2002 HSBC annual report below. You can navigate through the pages in the report by either clicking on the pages listed below, or by using the keyword search tool below to find specific information within the annual report.-
 1
1 -
2
-
3
-
4
-
5
-
6
-
7
-
8
-
9
-
10
-
11
-
12
-
13
-
14
-
15
-
16
-
17
-
18
-
19
-
20
-
21
-
22
-
23
-
24
-
25
-
26
-
27
-
28
-
29
-
30
-
31
-
32
-
33
-
34
-
35
-
36
-
37
-
38
-
39
-
40
-
41
-
42
-
43
-
44
-
45
-
46
-
47
-
48
-
49
-
50
-
51
-
52
-
53
-
54
-
55
-
56
-
57
-
58
-
59
-
60
-
61
-
62
-
63
-
64
-
65
-
66
-
67
-
68
-
69
-
70
-
71
-
72
-
73
-
74
-
75
-
76
-
77
-
78
-
79
-
80
-
81
-
82
-
83
-
84
-
85
-
86
-
87
-
88
-
89
-
90
-
91
-
92
-
93
-
94
-
95
-
96
-
97
-
98
-
99
-
100
-
101
-
102
-
103
-
104
-
105
-
106
-
107
-
108
-
109
-
110
-
111
-
112
-
113
-
114
-
115
-
116
-
117
-
118
-
119
-
120
-
121
-
122
-
123
-
124
-
125
-
126
-
127
-
128
-
129
-
130
-
131
-
132
-
133
-
134
-
135
-
136
-
137
-
138
-
139
-
140
-
141
-
142
-
143
-
144
-
145
-
146
-
147
-
148
-
149
-
150
-
151
-
152
-
153
-
154
-
155
-
156
-
157
-
158
-
159
-
160
-
161
-
162
-
163
-
164
-
165
-
166
-
167
-
168
-
169
-
170
-
171
-
172
-
173
-
174
-
175
-
176
-
177
-
178
-
179
-
180
-
181
-
182
-
183
-
184
-
185
-
186
-
187
-
188
-
189
-
190
-
191
-
192
-
193
-
194
-
195
-
196
-
197
-
198
-
199
-
200
-
201
-
202
-
203
-
204
-
205
-
206
-
 207
207 -
 208
208 -
 209
209 -
 210
210 -
 211
211 -
 212
212 -
 213
213 -
 214
214 -
 215
215 -
 216
216 -
 217
217 -
 218
218 -
 219
219 -
 220
220 -
 221
221 -
 222
222 -
 223
223 -
 224
224 -
 225
225 -
 226
226 -
 227
227 -
228
-
229
-
230
-
231
-
232
-
233
-
234
-
235
-
236
-
237
-
238
-
239
-
240
-
241
-
242
-
243
-
244
-
245
-
246
-
247
-
248
-
249
-
250
-
251
-
252
-
253
-
254
-
255
-
256
-
257
-
258
-
259
-
260
-
261
-
262
-
263
-
264
-
265
-
266
-
267
-
268
-
269
-
270
-
271
-
272
-
273
-
274
-
275
-
276
-
277
-
278
-
279
-
280
-
281
-
282
-
283
-
284
-
285
-
286
-
287
-
288
-
289
-
290
-
291
-
292
-
293
-
294
-
295
-
296
-
297
-
298
-
299
-
300
-
301
-
302
-
303
-
304
-
305
-
306
-
307
-
308
-
309
-
310
-
311
-
312
-
313
-
314
-
315
-
316
-
317
-
318
-
319
-
320
-
321
-
322
-
323
-
324
-
325
-
326
-
327
-
328
-
329
 |
 |

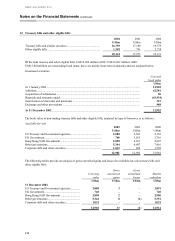
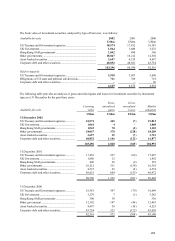
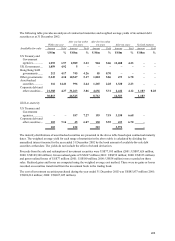
215
Carryin
g
value
Gross
unrealise
d
gains
Gross
unrealise
d
losses Market
valuation
US$m US$m US$m US$m
31 December 2001
US Treasury and Government agencies............ 2,303 1 – 2,304
UK Government................................................ 3,013 6 – 3,019
Hong Kong SAR Government .......................... 2,181 2 – 2,183
Other governments............................................ 4,907 7 (3) 4,911
Corporate debt and other securities................... 498 – – 498
12,902 16 (3) 12,915
Carryin
g
value
Gross
unrealise
d
gains
Gross
unrealise
d
losses Market
valuation
US$m US$m US$m US$m
31 December 2000
US Treasury and Government agencies............ 2,165 1 – 2,166
UK Government................................................ 2,716 – (15) 2,701
Hong Kong SAR Government .......................... 2,007 – – 2,007
Other governments............................................ 7,416 13 (6) 7,423
Corporate debt and other securities................... 1,558 – (24) 1,534
15,862 14 (45) 15,831
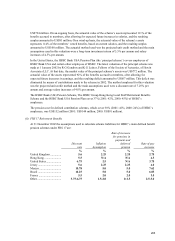
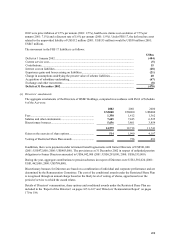
The amounts shown under “other governments” in the above table include securities with a book value of US$1,122
million (2001: US$1,793 million) and a market value of US$1,122 million (2001: US$1,792 million) issued by the
government of Japan.
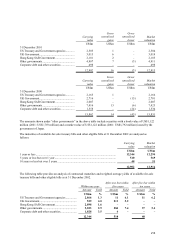
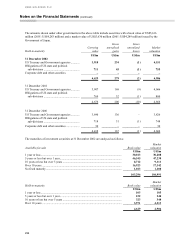
The maturities of available-for-sale treasury bills and other eligible bills at 31 December 2002 are analysed as
follows:
Carryin
g
value
M
arke
t
valuation
US$m US$m
1 year or less .............................................................................................................. 12,344 12,294
5 years or less but over 1 year.................................................................................... 510 569
10 years or less but over 5 years ................................................................................ 48 51
12,902 12,914
The following table provides an analysis of contractual maturities and weighted average yields of available-for-sale
treasury bills and other eligible bills as at 31 December 2002.
Within one year After one but within
five years After five but within
ten years
Amount Yiel
d
Amoun
t
Yiel
d
Amoun
t
Yiel
d
US$m % US$m % US$m %
US Treasury and Government agencies............... 2,866 1.3 11 6.1 11 6.2
UK Government................................................... 529 4.0 211 5.2
–
–
Hong Kong SAR Government ............................. 2,898 1.6
–
–
–
–
Other governments............................................... 5,023 2.9 284 7.4 37 5.4
Corporate debt and other securities...................... 1,028 3.5 4
–
–
–
12,344 510 48