HSBC 2002 Annual Report Download - page 274
Download and view the complete annual report
Please find page 274 of the 2002 HSBC annual report below. You can navigate through the pages in the report by either clicking on the pages listed below, or by using the keyword search tool below to find specific information within the annual report.-
 1
1 -
2
-
3
-
4
-
5
-
6
-
7
-
8
-
9
-
10
-
11
-
12
-
13
-
14
-
15
-
16
-
17
-
18
-
19
-
20
-
21
-
22
-
23
-
24
-
25
-
26
-
27
-
28
-
29
-
30
-
31
-
32
-
33
-
34
-
35
-
36
-
37
-
38
-
39
-
40
-
41
-
42
-
43
-
44
-
45
-
46
-
47
-
48
-
49
-
50
-
51
-
52
-
53
-
54
-
55
-
56
-
57
-
58
-
59
-
60
-
61
-
62
-
63
-
64
-
65
-
66
-
67
-
68
-
69
-
70
-
71
-
72
-
73
-
74
-
75
-
76
-
77
-
78
-
79
-
80
-
81
-
82
-
83
-
84
-
85
-
86
-
87
-
88
-
89
-
90
-
91
-
92
-
93
-
94
-
95
-
96
-
97
-
98
-
99
-
100
-
101
-
102
-
103
-
104
-
105
-
106
-
107
-
108
-
109
-
110
-
111
-
112
-
113
-
114
-
115
-
116
-
117
-
118
-
119
-
120
-
121
-
122
-
123
-
124
-
125
-
126
-
127
-
128
-
129
-
130
-
131
-
132
-
133
-
134
-
135
-
136
-
137
-
138
-
139
-
140
-
141
-
142
-
143
-
144
-
145
-
146
-
147
-
148
-
149
-
150
-
151
-
152
-
153
-
154
-
155
-
156
-
157
-
158
-
159
-
160
-
161
-
162
-
163
-
164
-
165
-
166
-
167
-
168
-
169
-
170
-
171
-
172
-
173
-
174
-
175
-
176
-
177
-
178
-
179
-
180
-
181
-
182
-
183
-
184
-
185
-
186
-
187
-
188
-
189
-
190
-
191
-
192
-
193
-
194
-
195
-
196
-
197
-
198
-
199
-
200
-
201
-
202
-
203
-
204
-
205
-
206
-
207
-
208
-
209
-
210
-
211
-
212
-
213
-
214
-
215
-
216
-
217
-
218
-
219
-
220
-
221
-
222
-
223
-
224
-
225
-
226
-
227
-
228
-
229
-
230
-
231
-
232
-
233
-
234
-
235
-
236
-
237
-
238
-
239
-
240
-
241
-
242
-
243
-
244
-
245
-
246
-
247
-
248
-
249
-
250
-
251
-
252
-
253
-
254
-
255
-
256
-
257
-
258
-
259
-
260
-
261
-
262
-
263
-
 264
264 -
 265
265 -
 266
266 -
 267
267 -
 268
268 -
 269
269 -
 270
270 -
 271
271 -
 272
272 -
 273
273 -
 274
274 -
 275
275 -
 276
276 -
 277
277 -
 278
278 -
 279
279 -
 280
280 -
 281
281 -
 282
282 -
 283
283 -
 284
284 -
285
-
286
-
287
-
288
-
289
-
290
-
291
-
292
-
293
-
294
-
295
-
296
-
297
-
298
-
299
-
300
-
301
-
302
-
303
-
304
-
305
-
306
-
307
-
308
-
309
-
310
-
311
-
312
-
313
-
314
-
315
-
316
-
317
-
318
-
319
-
320
-
321
-
322
-
323
-
324
-
325
-
326
-
327
-
328
-
329
 |
 |

HSBC HOLDINGS PLC
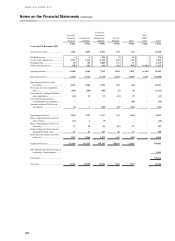
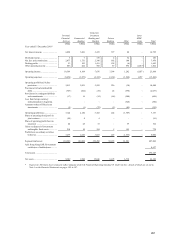
Notes on the Financial Statements (continued)
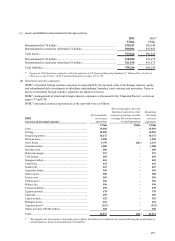
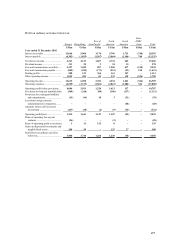
272
2001
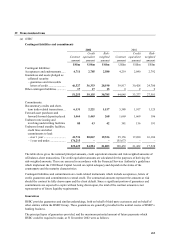
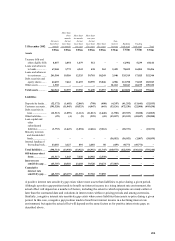
Currency of structural exposure
Net investments
in overseas
operations
Currenc
y
hedges other
than
borrowings
Borrowings taken out in the
functional currencies of the
overseas operations in order to
hedge the net investments in
such operations
R
emaining
s
tructura
l
currency
exposures
US$m US$m US$m US$m
Euros ..................................................... 13,944
–
–
13,944
Hong Kong dollars ................................ 9,407
–
(3) 9,404
Sterling .................................................. 8,303 (120)
–
8,183
Swiss francs........................................... 1,241
–
(559) 682
Canadian dollars.................................... 959
–
–
959
Brazilian reais........................................ 454 (301)
–
153
UAE dirham .......................................... 440
–
–
440
Singapore dollars................................... 410 (97)
–
313
Malaysian ringgit................................... 403
–
–
403
Saudi riyals............................................ 395
–
–
395
Turkish lira............................................ 395
–
–
395
Indian rupees ......................................... 286
–
–
286
Australian dollars .................................. 272
–
(52) 220
Korean won ........................................... 231
–
–
231
Chilean pesos ........................................ 170
–
–
170
Taiwanese dollars.................................. 169
–
–
169
Thai baht ............................................... 162
–
–
162
Maltese lira............................................ 155
–
–
155
Cyprus pounds....................................... 108
–
–
108
Philippine pesos..................................... 103
–
–
103
Argentine pesos* ................................... (140)
–
–
(140)
Others, less than US$100 million.......... 559 (64)
–
495
Total ...................................................... 38,426 (582) (614) 37,230
* The negative net investment in Argentine pesos reflects the deficiency in domestic net assets following the pesification of
certain balances formerly denominated in US dollars.