HSBC 2002 Annual Report Download - page 47
Download and view the complete annual report
Please find page 47 of the 2002 HSBC annual report below. You can navigate through the pages in the report by either clicking on the pages listed below, or by using the keyword search tool below to find specific information within the annual report.-
 1
1 -
2
-
3
-
4
-
5
-
6
-
7
-
8
-
9
-
10
-
11
-
12
-
13
-
14
-
15
-
16
-
17
-
18
-
19
-
20
-
21
-
22
-
23
-
24
-
25
-
26
-
27
-
28
-
29
-
30
-
31
-
32
-
33
-
34
-
35
-
36
-
 37
37 -
 38
38 -
 39
39 -
 40
40 -
 41
41 -
 42
42 -
 43
43 -
 44
44 -
 45
45 -
 46
46 -
 47
47 -
 48
48 -
 49
49 -
 50
50 -
 51
51 -
 52
52 -
 53
53 -
 54
54 -
 55
55 -
 56
56 -
 57
57 -
58
-
59
-
60
-
61
-
62
-
63
-
64
-
65
-
66
-
67
-
68
-
69
-
70
-
71
-
72
-
73
-
74
-
75
-
76
-
77
-
78
-
79
-
80
-
81
-
82
-
83
-
84
-
85
-
86
-
87
-
88
-
89
-
90
-
91
-
92
-
93
-
94
-
95
-
96
-
97
-
98
-
99
-
100
-
101
-
102
-
103
-
104
-
105
-
106
-
107
-
108
-
109
-
110
-
111
-
112
-
113
-
114
-
115
-
116
-
117
-
118
-
119
-
120
-
121
-
122
-
123
-
124
-
125
-
126
-
127
-
128
-
129
-
130
-
131
-
132
-
133
-
134
-
135
-
136
-
137
-
138
-
139
-
140
-
141
-
142
-
143
-
144
-
145
-
146
-
147
-
148
-
149
-
150
-
151
-
152
-
153
-
154
-
155
-
156
-
157
-
158
-
159
-
160
-
161
-
162
-
163
-
164
-
165
-
166
-
167
-
168
-
169
-
170
-
171
-
172
-
173
-
174
-
175
-
176
-
177
-
178
-
179
-
180
-
181
-
182
-
183
-
184
-
185
-
186
-
187
-
188
-
189
-
190
-
191
-
192
-
193
-
194
-
195
-
196
-
197
-
198
-
199
-
200
-
201
-
202
-
203
-
204
-
205
-
206
-
207
-
208
-
209
-
210
-
211
-
212
-
213
-
214
-
215
-
216
-
217
-
218
-
219
-
220
-
221
-
222
-
223
-
224
-
225
-
226
-
227
-
228
-
229
-
230
-
231
-
232
-
233
-
234
-
235
-
236
-
237
-
238
-
239
-
240
-
241
-
242
-
243
-
244
-
245
-
246
-
247
-
248
-
249
-
250
-
251
-
252
-
253
-
254
-
255
-
256
-
257
-
258
-
259
-
260
-
261
-
262
-
263
-
264
-
265
-
266
-
267
-
268
-
269
-
270
-
271
-
272
-
273
-
274
-
275
-
276
-
277
-
278
-
279
-
280
-
281
-
282
-
283
-
284
-
285
-
286
-
287
-
288
-
289
-
290
-
291
-
292
-
293
-
294
-
295
-
296
-
297
-
298
-
299
-
300
-
301
-
302
-
303
-
304
-
305
-
306
-
307
-
308
-
309
-
310
-
311
-
312
-
313
-
314
-
315
-
316
-
317
-
318
-
319
-
320
-
321
-
322
-
323
-
324
-
325
-
326
-
327
-
328
-
329
 |
 |
45
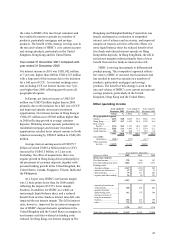
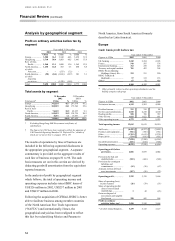
In the rest of Asia-Pacific, costs in 2002,
excluding goodwill amortisation, increased by
US$131 million, or 9 per cent compared with 2001.
This growth in costs primarily reflected a higher staff
complement in Group Service Centres in India and
mainland China and the expansion of business in
several countries in the region, in particular mainland
China, Taiwan, the Middle East and in Australia
through the acquisition of NRMA. During the year
The Hongkong and Shanghai Banking Corporation
opened eight new branches in the Asia Pacific
region.
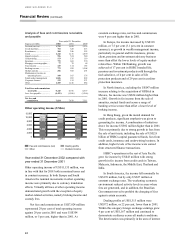
Operating expenses in North America, excluding
goodwill amortisation, increased by US$135 million,
or 5 per cent, in 2002. This increase was largely
driven by the impact of the acquisition of GFBital
and the costs associated with the establishment of the
WTAS business in the United States. A reduction in
the costs associated with ongoing development of
hsbc.com offset additional costs relating to the
closure of the institutional equity business in Canada
and the restructuring of the merchant banking
business in the United States.
In South America, operating expenses, excluding
goodwill amortisation, fell by US$437 million, or 29
per cent, during 2002. At constant exchange rates
operating expenses, excluding goodwill amortisation,
were 4 per cent higher than in 2001. The increase
related to industry-wide union agreed salary
adjustments in Brazil and costs of severance as
headcount reductions were made in the recessionary
environment.
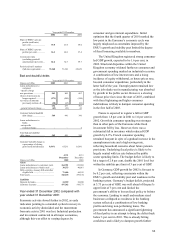
Year ended 31 December 2001 compared with
year ended 31 December 2000
Operating expenses were US$1,317 million higher
than in 2000. This increase was mainly driven by the
recent acquisitions together with a related US$289
million increase in goodwill amortisation.
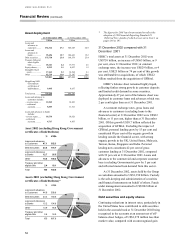
In Europe, costs, excluding goodwill
amortisation, increased by US$770 million compared
with 2000 and included US$128 million of
restructuring costs. At constant exchange rates, costs
in 2001, excluding goodwill amortisation, were
US$1,023 million, or 16 per cent, higher than in
2000, of which the inclusion of CCF’ s cost base
accounted for US$769 million. Business expansion
and increased information technology-related
expenditure to support business development
projects lay at the heart of the cost increase.
In Hong Kong, costs in 2001, excluding
goodwill amortisation, increased by US$154 million,
or 8 per cent, compared with 2000. Staff costs
increased by 10 per cent mainly to support business
expansion in personal financial services, particularly
in credit card and Mandatory Provident Fund
products. Operating expenses, other than staff costs,
rose by 5 per cent to support wealth management
expansion and the development of e-banking
initiatives.
In the rest of Asia-Pacific, operating expenses,
excluding goodwill amortisation, increased by
US$105 million, or 8 per cent, compared to 2000. At
constant exchange rates, the increase was 16 per
cent. Recent acquisitions accounted for some US$31
million of the cost increase. The remaining growth in
costs reflected higher staff numbers to support
business expansion, particularly in personal financial
services and wealth management initiatives together
with a doubling of complement in our shared service
centres in India and mainland China.
Operating costs, excluding goodwill
amortisation, in North America were US$144
million, or 6 per cent, higher than in 2000. Of this
increase, US$164 million related to development
costs associated with hsbc.com. The underlying
change in operating costs was a decrease of 1 per
cent. This principally reflected a 2 per cent fall in the
domestic cost base of HSBC Bank USA with a
reduced level of restructuring charges offset by
business expansion costs.
In South America, operating expenses at
constant exchange rates were US$133 million, or 10
per cent, higher than in 2001. This mainly reflected
the acquisition of CCF Brazil and restructuring costs.
As economic conditions become less certain in the
region, further cost controls were put in place to
restrain cost growth.
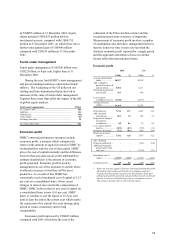
The Group’s global processing initiatives
continue to develop with some 2000 staff employed
at HSBC’s global processing centres in mainland
China and India at 31 December 2001.
HSBC’s cost: income ratio, excluding goodwill
amortisation, was 56.4 per cent in 2001, reflecting
the cost structure of new acquisitions and investment
in the expanding wealth management businesses and
IT.