HSBC 2002 Annual Report Download - page 79
Download and view the complete annual report
Please find page 79 of the 2002 HSBC annual report below. You can navigate through the pages in the report by either clicking on the pages listed below, or by using the keyword search tool below to find specific information within the annual report.-
 1
1 -
2
-
3
-
4
-
5
-
6
-
7
-
8
-
9
-
10
-
11
-
12
-
13
-
14
-
15
-
16
-
17
-
18
-
19
-
20
-
21
-
22
-
23
-
24
-
25
-
26
-
27
-
28
-
29
-
30
-
31
-
32
-
33
-
34
-
35
-
36
-
37
-
38
-
39
-
40
-
41
-
42
-
43
-
44
-
45
-
46
-
47
-
48
-
49
-
50
-
51
-
52
-
53
-
54
-
55
-
56
-
57
-
58
-
59
-
60
-
61
-
62
-
63
-
64
-
65
-
66
-
67
-
68
-
 69
69 -
 70
70 -
 71
71 -
 72
72 -
 73
73 -
 74
74 -
 75
75 -
 76
76 -
 77
77 -
 78
78 -
 79
79 -
 80
80 -
 81
81 -
 82
82 -
 83
83 -
 84
84 -
 85
85 -
 86
86 -
 87
87 -
 88
88 -
 89
89 -
90
-
91
-
92
-
93
-
94
-
95
-
96
-
97
-
98
-
99
-
100
-
101
-
102
-
103
-
104
-
105
-
106
-
107
-
108
-
109
-
110
-
111
-
112
-
113
-
114
-
115
-
116
-
117
-
118
-
119
-
120
-
121
-
122
-
123
-
124
-
125
-
126
-
127
-
128
-
129
-
130
-
131
-
132
-
133
-
134
-
135
-
136
-
137
-
138
-
139
-
140
-
141
-
142
-
143
-
144
-
145
-
146
-
147
-
148
-
149
-
150
-
151
-
152
-
153
-
154
-
155
-
156
-
157
-
158
-
159
-
160
-
161
-
162
-
163
-
164
-
165
-
166
-
167
-
168
-
169
-
170
-
171
-
172
-
173
-
174
-
175
-
176
-
177
-
178
-
179
-
180
-
181
-
182
-
183
-
184
-
185
-
186
-
187
-
188
-
189
-
190
-
191
-
192
-
193
-
194
-
195
-
196
-
197
-
198
-
199
-
200
-
201
-
202
-
203
-
204
-
205
-
206
-
207
-
208
-
209
-
210
-
211
-
212
-
213
-
214
-
215
-
216
-
217
-
218
-
219
-
220
-
221
-
222
-
223
-
224
-
225
-
226
-
227
-
228
-
229
-
230
-
231
-
232
-
233
-
234
-
235
-
236
-
237
-
238
-
239
-
240
-
241
-
242
-
243
-
244
-
245
-
246
-
247
-
248
-
249
-
250
-
251
-
252
-
253
-
254
-
255
-
256
-
257
-
258
-
259
-
260
-
261
-
262
-
263
-
264
-
265
-
266
-
267
-
268
-
269
-
270
-
271
-
272
-
273
-
274
-
275
-
276
-
277
-
278
-
279
-
280
-
281
-
282
-
283
-
284
-
285
-
286
-
287
-
288
-
289
-
290
-
291
-
292
-
293
-
294
-
295
-
296
-
297
-
298
-
299
-
300
-
301
-
302
-
303
-
304
-
305
-
306
-
307
-
308
-
309
-
310
-
311
-
312
-
313
-
314
-
315
-
316
-
317
-
318
-
319
-
320
-
321
-
322
-
323
-
324
-
325
-
326
-
327
-
328
-
329
 |
 |

77
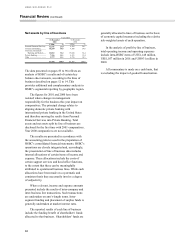
performance-related bonuses on improved trading
revenues together with additional headcount building
on the successful trading platform in place.
Operating expenses in the domestic operations of
HSBC Bank USA were 2 per cent lower compared to
2000. A reduced level of acquisition related
restructuring charges in 2001 was offset by business
expansion in treasury, wealth management and e-
commerce, and increased marketing expenses.
Higher depreciation expense resulting from
infrastructure improvements represents a delayed
restructuring charge. In Canada, excluding HSBC
Invest Direct Inc’s costs in 2000, operating expenses
were US$29 million lower, or 6 per cent, of which
US$24 million related to lower staff costs mainly
lower performance related bonuses as a result of
lower levels of trading revenues in the scaled back
equity operations. Lower volumes of transaction-
driven costs and continuing efforts to improve
operational efficiencies reduced other operating
expenses by US$5 million.
Credit quality deteriorated modestly during
2001. In the United States new specific provisions of
US$313 million, were US$25 million lower than in
2001 and took into account requirements against an
exposure to a corporate customer in the energy
sector. An increase in new specific provisions in
Canada of US$40 million related to the deterioration
of a small number of commercial facilities, notably
in the telecommunications sector. Releases and
recoveries were consistent with 2000 and the net
increase in the bad and doubtful debt charge of
US$143 million reflects the release of general
provision in the United States in 2000 not repeated in
2001.
In terms of non-performing loans overall credit
quality remained stable in 2001 with non-performing
loans at 31 December 2001 at US$671 million
compared with US$684 million at 31 December
2000. It was early to determine the medium to
longer-term effect that the events of 11 September,
the impact on market liquidity of the Enron collapse
and the general economic slowdown may have on
the overall credit portfolio.
Gains on disposal of investments amounted to
US$132 million, an increase of US$97 million
compared with 2000. During the year, but
substantially in the first half, HSBC’s operations in
the United States sold mortgage-backed securities to
reduce exposure to refinancing mortgages in a
declining interest rate environment.
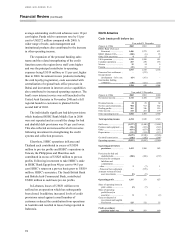
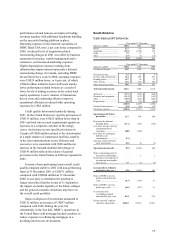
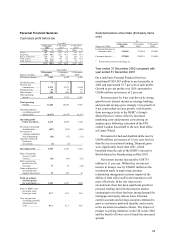
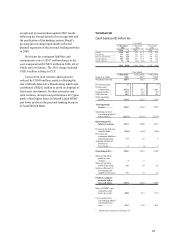
South America
Cash basis profit before tax
Year ended 31 December
Figures in US$m 2002 2001 2000
Brazil .................................... 127 136 208
Argentina .............................. (210) (1,152 ) 112
Chile .................................... 72 17 8
Othe
r
.................................... (23 ) (3 ) (15)
(34 ) (1,002 ) 313
Year ended 31 December
Figures in US$m 2002 2001 2000
Net interest income ............... 645 1,065 1,186
Dividend income................... 15 12 8
Net fees and commissions ..... 324 494 471
Dealing profits ...................... 147 18 57
Other income......................... 110 356 396
Other operating income......... 596 880 932
Total operating income 1,241 1,945 2,118
Staff costs ............................. (572) (836) (890 )
Premises and equipmen
t
........ (113) (153) (162 )
Othe
r
.................................... (330) (435) (486 )
Depreciatio
n
.......................... (45 ) (73 ) (64)
(1,060) (1,497 ) (1,602)
Goodwill amortisatio
n
........... (24 ) (14 ) (12)
Operating expenses ............... (1,084 ) (1,511) (1,614)
Operating profit before
provisions ........................ 157 434 504
Provisions for bad and
doubtful debts................... (117 ) (927) (194)
Loss from foreign currency
redenomination in
Argentina..........................
(
68)(520)
–
Provisions for contingent
liabilities and
commitments.................... (31 )
–
–
Amounts written off fixed
asset investments.............. (36) (1 ) (1)
Operating (loss)/profit......... (95 ) (1,014) 309
Share of operating profit in
associated undertakings .... –11
Gains/(losses) on disposal o
f
investments and tangible
fixed assets....................... 37 (3) (9 )
(Loss)/profit on ordinary
activities before ta
x
......... (58 ) (1,016 ) 301
Share of HSBC’ s pre-tax
profits (cash basis) (per
cent) ................................. (0.3) (11.4 ) 3.1
Share of HSBC’ s pre-tax
p
rofits (per cent)............... (0.6 ) (12.7) 3.1
Cost:income ratio
(excluding goodwill
amortisation) (per cent) 85.4 77.0 75.6
Period-end staff numbers
(full-time equivalent)........ 25,522 27,519 25,671