Boeing 2005 Annual Report Download - page 75
Download and view the complete annual report
Please find page 75 of the 2005 Boeing annual report below. You can navigate through the pages in the report by either clicking on the pages listed below, or by using the keyword search tool below to find specific information within the annual report.-
 1
1 -
2
-
3
-
4
-
5
-
6
-
7
-
8
-
9
-
10
-
11
-
12
-
13
-
14
-
15
-
16
-
17
-
18
-
19
-
20
-
21
-
22
-
23
-
24
-
25
-
26
-
27
-
28
-
29
-
30
-
31
-
32
-
33
-
34
-
35
-
36
-
37
-
38
-
39
-
40
-
41
-
42
-
43
-
44
-
45
-
46
-
47
-
48
-
49
-
50
-
51
-
52
-
53
-
54
-
55
-
56
-
57
-
58
-
59
-
60
-
61
-
62
-
63
-
64
-
 65
65 -
 66
66 -
 67
67 -
 68
68 -
 69
69 -
 70
70 -
 71
71 -
 72
72 -
 73
73 -
 74
74 -
 75
75 -
 76
76 -
 77
77 -
 78
78 -
 79
79 -
 80
80 -
 81
81 -
 82
82 -
 83
83 -
 84
84 -
 85
85 -
86
-
87
-
88
-
89
-
90
-
91
-
92
-
93
-
94
-
95
-
96
-
97
-
98
-
99
-
100
 |
 |

Notes to Consolidated Financial Statements
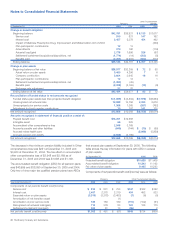
The following table summarizes the activity of stock options
issued to directors, officers and other employees:
December 31, 2005
Weighted-
Average
Excercise
(Shares in thousands) Shares Price
Weighted-
Average
Remaining
Contractual
Life (years)
Aggregate
Intrinsic
Value
(in millions)
Number of shares
under option:
Outstanding at
beginning
of year
Granted
Exercised
Forfeited
Expired
Outstanding at
end of year
24,727
4
(8,216)
(107)
(50)
16,358
$44.49
67.53
42.68
43.35
46.02
45.40 4.15 $406
Exercisable at
end of year 13,660 $46.20 3.60 $328
The total intrinsic value of options exercised was $170, $44
and $11 during the years ended December 31, 2005, 2004
and 2003. Cash received from options exercised for the years
ended December 31, 2005, 2004 and 2003 was $348, $98
and $18 with a related tax benefit of $59, $13 and $3 derived
from the compensation deductions resulting from these option
exercises. Stock options granted during 2005, 2004, and 2003
were not material. At December 31, 2005, there was $6 of total
unrecognized compensation cost related to the Stock Option
plan which is expected to be recognized over a weighted aver-
age period of 2.2 years.
The fair value of stock-based compensation awards granted
was estimated using a binomial option-pricing model with the
following assumptions:
Risk Weighted-
Free Average
Grant Grant Expected Expected Dividend Interest Grant Date
Year Date Life Volatility Yeild Rate Fair Value
2005 8/23/05 9 years 29% 1.5% 4.2% $25.01
2004 12/17/04 9 years 31% 1.1% 4.2% 18.60
2003 9/29/03 9 years 31% 1.1% 4.1% 13.76
ShareValue Trust
The ShareValue Trust, established effective July 1, 1996, is a
14-year irrevocable trust that holds our common stock,
receives dividends and distributes to employees the apprecia-
tion in value above a 3% per annum threshold rate of return.
The total compensation expense to be recognized over the life
of the trust was determined using a binomial option-pricing
model and was not affected by adoption of SFAS No.123R.
The Trust was split between two funds, “fund 1” and “fund 2”,
upon its initial funding. Each fund consists of investment peri-
ods which result in overlapping periods as follows:
Period 1 (fund 1): July 1, 1996 to June 30, 1998
Period 2 (fund 2): July 1, 1996 to June 30, 2000
Period 3 (fund 1): July 1, 1998 to June 30, 2002
Period 4 (fund 2): July 1, 2000 to June 30, 2004
Period 5 (fund 1): July 1, 2002 to June 30, 2006
Period 6 (fund 2): July 1, 2004 to June 30, 2008
Period 7 (fund 1): July 1, 2006 to June 30, 2010
An initial investment value is established for each investment
period based on the lesser of either (1) fair market value of the
fund or (2) the prior ending balance of that fund. This amount is
then compounded by the 3% per annum to determine the
threshold amount that must be met for that investment period.
At the end of the investment period, the value of the invest-
ment in excess of the threshold amount will result in a distribu-
tion to participants. A distribution is proportionally distributed in
the ratio each participant’s number of months of participation
relates to the total number of months earned by all participants
in the investment period. At December 31, 2005, the Trust held
39,593,463 shares of our common stock in the two funds.
On June 30, 2004, the market value of fund 2 exceeded $913
(the threshold representing a 3% per annum rate of return).
Based on the average stock price of $50.825 as of June 30,
2004, the market value of fund 2 exceeded the threshold by
$143 resulting in a distribution to participants. The distribution
was paid in Boeing common stock, except for partial shares,
distributions to foreign employees and beneficiaries of
deceased participants, which were paid in cash. After
employee withholding taxes, approximately 1.7 million shares of
common stock were distributed to participants. These transac-
tions were recorded as a deduction from additional paid-in
capital.
If on June 30, 2006, the market value of fund 1 exceeds
$1,004, the amount in excess of the threshold will be distrib-
uted to employees in shares of common stock. Similarly, if on
June 30, 2008, the market value of fund 2 exceeds $1,028, the
amount in excess of the threshold will be distributed to employ-
ees in shares of common stock.
The ShareValue Trust is accounted for as a contra-equity
account and stated at market value. Market value adjustments
are offset to additional paid-in capital. At December 31, 2005,
there was $325 of total unrecognized compensation cost
related to the ShareValue Trust which is expected to be recog-
nized over a period of 4.5 years.
Other stock unit awards
The total number of stock unit awards that are convertible only
to common stock and not contingent upon stock price were
2,037,438, 2,019,250 and 1,910,293 at December 31, 2005,
2004 and 2003.
The Boeing Company and Subsidiaries 73