Boeing 2005 Annual Report Download - page 59
Download and view the complete annual report
Please find page 59 of the 2005 Boeing annual report below. You can navigate through the pages in the report by either clicking on the pages listed below, or by using the keyword search tool below to find specific information within the annual report.
Notes to Consolidated Financial Statements
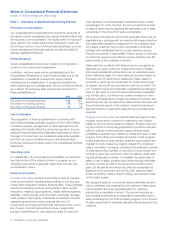
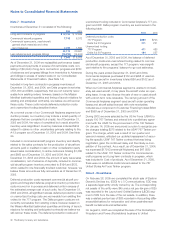
Note 3 - Goodwill and Acquired Intangibles
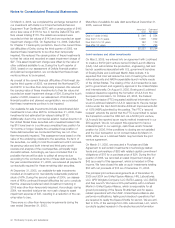
The changes in the carrying amount of goodwill by reportable segment for the years ended December 31, 2005, 2004 and 2003
were as follows:
)
)
Aircraft & Launch
Commercial Weapon Network Support & Orbital
Airplanes Systems Systems Systems Systems Other Total
Balance at January 1, 2003 $627 $317 $1,124 $117 $572 $3 $2,760
Goodwill Adjustments (4) (4
Acquisitions 70 70
Impairment Losses (341) (572) (913
Balance at December 31, 2003 $282 $317 $1,194 $117 $3 $1,913
Goodwill Adjustments 25 2 27
)
Acquisitions 11 11
Impairment Losses (3) (3
Balance at December 31, 2004 $282 $353 $1,196 $117 $1,948
Goodwill Adjustments 21 (13) (18) 11 1
)Divestitures (23) (2) (25
Balance at December 31, 2005 $280 $340 $1,176 $128 $1,924
During 2003 we recognized impairment losses due to our IDS
segment reorganization. We reorganized our Military Aircraft
and Missile Systems and Space and Communications seg-
ments into IDS. This reorganization triggered a goodwill impair-
ment analysis as of January 1, 2003. Our analysis took into
consideration the lower stock price as of April 1, 2003, to
include the impact of the required annual impairment test. As a
result of this impairment analysis, we recorded a goodwill
impairment charge of $913 at Commercial Airplanes and
Launch & Orbital Systems. Combining businesses with no
goodwill but unfavorable projected cash flows, with business
that had goodwill but favorable projected cash flows, resulted
in the cash flows of the combined businesses being unable to
support the goodwill of the resultant reporting units.
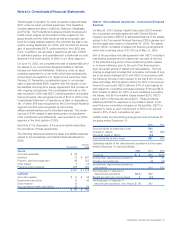
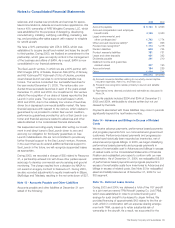
The gross carrying amounts and accumulated amortization of
our other acquired intangible assets were as follows at
December 31:
2005 2004
Gross
Carrying Accumulated
Amount Amortization
Gross
Carrying Accumulated
Amount Amortization
Developed technology $ 576
Product know-how 308
Customer base 96
Other 173
$312 $ 578 $256
54 308 44
34 106 29
75 150 55
$1,153 $475 $1,142 $384
Amortization expense for acquired finite-lived intangible assets
for the years ended December 31, 2005 and 2004 was $91
and $97. Estimated amortization expense for the five succeed-
ing years are as follows:
Estimated
Amortization Expense
2006 $85
2007 85
2008 85
2009 84
2010 66
As of December 31, 2005 and 2004, we had one indefinite-
lived intangible asset, a trademark, with a carrying amount of
$197.
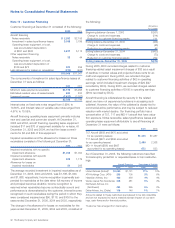
Note 4 - Earnings Per Share
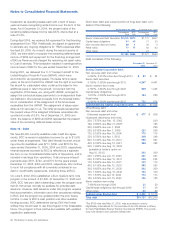
The weighted-average number of shares outstanding (in mil-
lions) for the years ended December 31, used to compute
earnings per share are as follows:
2005 2004 2003
Weighted-average
shares outstanding 779.4 800.2 800.1
Participating securities 9.1 6.8 5.3
Basic weighted-average
shares outstanding 788.5 807.0 805.4
Diluted potential common shares 14.4 6.0 3.5
Diluted weighted-average
shares outstanding 802.9 813.0 808.9
Basic earnings per share is calculated by the sum of (1) net
income less dividends paid divided by the basic weighted aver-
age shares outstanding and (2) dividends paid divided by the
weighted average shares outstanding. Diluted earnings per
share is calculated by dividing net income by the diluted
weighted average shares outstanding.
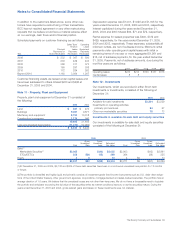
The weighted-average number of shares outstanding for the
year ended December 31 (in millions), included in the table
below, is excluded from the computation of diluted earnings
per share because the average market price did not exceed
the exercise/threshold price. However, these shares may be
dilutive potential common shares in the future.
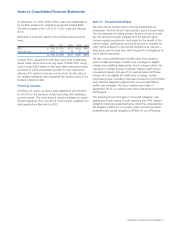
2005 2004 2003
Stock options 0.2 10.9 25.0
Stock units 0.2
Performance Shares 24.9 28.6 24.2
ShareValue Trust 33.9 38.4 41.2
The Boeing Company and Subsidiaries 57


