Boeing 2005 Annual Report Download - page 29
Download and view the complete annual report
Please find page 29 of the 2005 Boeing annual report below. You can navigate through the pages in the report by either clicking on the pages listed below, or by using the keyword search tool below to find specific information within the annual report.-
 1
1 -
2
-
3
-
4
-
5
-
6
-
7
-
8
-
9
-
10
-
11
-
12
-
13
-
14
-
15
-
16
-
17
-
18
-
 19
19 -
 20
20 -
 21
21 -
 22
22 -
 23
23 -
 24
24 -
 25
25 -
 26
26 -
 27
27 -
 28
28 -
 29
29 -
 30
30 -
 31
31 -
 32
32 -
 33
33 -
 34
34 -
 35
35 -
 36
36 -
 37
37 -
 38
38 -
 39
39 -
40
-
41
-
42
-
43
-
44
-
45
-
46
-
47
-
48
-
49
-
50
-
51
-
52
-
53
-
54
-
55
-
56
-
57
-
58
-
59
-
60
-
61
-
62
-
63
-
64
-
65
-
66
-
67
-
68
-
69
-
70
-
71
-
72
-
73
-
74
-
75
-
76
-
77
-
78
-
79
-
80
-
81
-
82
-
83
-
84
-
85
-
86
-
87
-
88
-
89
-
90
-
91
-
92
-
93
-
94
-
95
-
96
-
97
-
98
-
99
-
100
 |
 |

Management’s Discussion and Analysis
and deliver items in sufficient time to meet our production
schedules. The need for such arrangements with suppliers and
vendors arises due to the extended production planning hori-
zon for many of our products, including commercial aircraft,
military aircraft and other products where delivery to the cus-
tomer occurs over an extended period of time. A significant
portion of these inventory commitments is supported by firm
contracts from customers, and/or has historically resulted in
settlement through reimbursement from such customers for
penalty payments to the supplier should the customer not take
delivery. These amounts are also included in our forecasts of
costs for program and contract accounting. Some inventory
procurement contracts may include escalation adjustments. In
these limited cases, we have included our best estimate of the
effect of the escalation adjustment in the amounts disclosed in
the table above.
Industrial participation agreements We have entered into various
industrial participation agreements with certain customers in
foreign countries to effect economic flow back and/or technol-
ogy transfer to their businesses or government agencies, as
the result of their procurement of goods and/or services from
us. These commitments may be satisfied by our placement of
direct work or vendor orders for supplies, opportunities to bid
on supply contracts, transfer of technology, or other forms of
assistance to the foreign country. However, in certain cases,
our commitments may be satisfied through other parties (such
as our vendors) who purchase supplies from our foreign cus-
tomers. We do not commit to industrial participation agree-
ments unless a contract for sale of our products or services is
signed. In certain cases, penalties could be imposed if we do
not meet our industrial participation commitments. During
2005, we incurred no such penalties. As of December 31,
2005, we have outstanding industrial participation agreements
totaling $6.3 billion that extend through 2019. In cases where
we satisfy our commitments through the purchase of supplies
and the criteria described in “purchase obligations” are met,
amounts are included in the table above. To be eligible for such
a purchase order commitment from us, the foreign country or
customer must have sufficient capability to meet our require-
ments and must be competitive in cost, quality and schedule.
Purchase obligations recorded on the
Consolidated Statement of Financial Position
Purchase obligations recorded on the statement of financial
position primarily include accounts payable and certain other
liabilities including accrued compensation and dividends
payable.
Off-Balance Sheet Arrangements
We are a party to certain off-balance sheet arrangements in-
cluding certain guarantees and variable interests in unconsolidated
entities. For discussion of these arrangements, see Note 21.
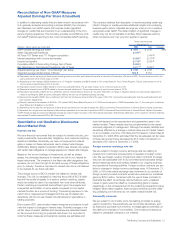
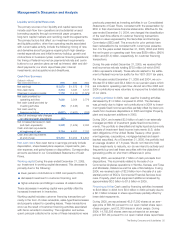
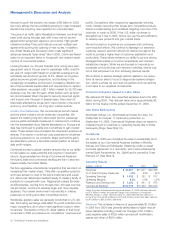
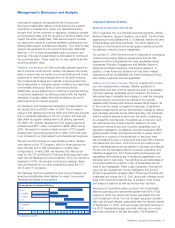
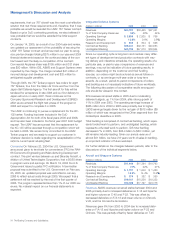
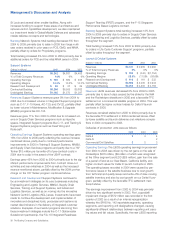
Commercial commitments The following table summarizes our
commercial commitments outstanding as of December 31,
2005, as well as an estimate of when these commitments are
expected to expire.
Total Amounts
Committed/Maximum Less than 1-3 4-5 After 5
(Dollars in millions) Amount of Loss 1 year years years years
Standby letters of
credit and surety bonds $««3,957 $3,719 $«««112 ««««««« $«««126
Aircraft financing
commercial commitments 13,496 872 6,672 $1,997 3,955
Total commercial
commitments $17,453 $4,591 $6,784 $1,997 $4,081
Related to the issuance of certain standby letters of credit and
surety bonds included in the above table, we received advance
payments of $274 million as of December 31, 2005.
Aircraft financing commercial commitments include commit-
ments to arrange or provide financing related to aircraft on
order or under option for deliveries scheduled through the year
2012. Based on historical experience, it is not anticipated that
all of these commitments will be exercised by our customers.
(See Note 21).
Industrial Revenue Bonds We utilize Industrial Revenue Bonds
(IRB) issued by the City of Wichita, Kansas and Fulton County,
Georgia to finance the purchase and/or construction of real
and personal property (See Note 21).
Segment Results of Operations and Financial Condition
Commercial Airplanes
Business Environment and Trends
Airline Industry Environment Gross domestic product (GDP)
growth, the primary driver of air traffic growth, remained
resilient in the face of rising energy prices in 2005. As a result,
worldwide passenger traffic growth continued above the long-
term trend in 2005 following double digit growth in 2004. Traffic
growth outpaced capacity increases pushing world load factors
to historical highs. Industry forecasts predict above average
traffic growth through at least 2007, although disease out-
breaks, increasing armed conflict or terrorist attacks, and
global economic imbalances represent ongoing risks.
Crude oil prices have almost doubled since the beginning of
2004. In addition, the price differential between oil and jet fuel
rose to historically high levels in 2005, triple the average over
the last 20 years. Although economic indicators show that the
world economy has adjusted to the current higher oil price lev-
els without significant slowdown, the rise in jet fuel prices is
outpacing airlines’ ability to increase revenues through fare
hikes and fuel surcharges and is pressuring less efficient airlines
in particular.
Worldwide, many airlines continue to report operating profits
although performance varies significantly by region and busi-
ness model. Industry financials generally show increasing unit
revenues and some improvement in fares. Combined with
progress on cost-cutting initiatives and efficiency improve-
ments, these trends are helping many airlines remain profitable
despite rising fuel prices and intense competition. Although the
industry’s aggregate financial health remains under the shadow
of the U.S. network carriers whose financial difficulties are
The Boeing Company and Subsidiaries 27