Boeing 2005 Annual Report Download - page 38
Download and view the complete annual report
Please find page 38 of the 2005 Boeing annual report below. You can navigate through the pages in the report by either clicking on the pages listed below, or by using the keyword search tool below to find specific information within the annual report.-
 1
1 -
2
-
3
-
4
-
5
-
6
-
7
-
8
-
9
-
10
-
11
-
12
-
13
-
14
-
15
-
16
-
17
-
18
-
19
-
20
-
21
-
22
-
23
-
24
-
25
-
26
-
27
-
 28
28 -
 29
29 -
 30
30 -
 31
31 -
 32
32 -
 33
33 -
 34
34 -
 35
35 -
 36
36 -
 37
37 -
 38
38 -
 39
39 -
 40
40 -
 41
41 -
 42
42 -
 43
43 -
 44
44 -
 45
45 -
 46
46 -
 47
47 -
 48
48 -
49
-
50
-
51
-
52
-
53
-
54
-
55
-
56
-
57
-
58
-
59
-
60
-
61
-
62
-
63
-
64
-
65
-
66
-
67
-
68
-
69
-
70
-
71
-
72
-
73
-
74
-
75
-
76
-
77
-
78
-
79
-
80
-
81
-
82
-
83
-
84
-
85
-
86
-
87
-
88
-
89
-
90
-
91
-
92
-
93
-
94
-
95
-
96
-
97
-
98
-
99
-
100
 |
 |

Management’s Discussion and Analysis
St Louis and several other smaller facilities. Along with
increased funding to support these areas of architecture and
network-centric capabilities development, we also maintained
our investment levels in Global Missile Defense and advanced
missile defense concepts and technologies.
Backlog Network Systems total backlog decreased 5% from
2004 to 2005 primarily due to sales in 2005 from large multi-
year orders received in prior years on FCS, GMD, and MMA,
partially offset by orders for Proprietary programs.
Total backlog increased 5% from 2003 to 2004 primarily due to
additional orders for FCS and the initial MMA award in 2004.
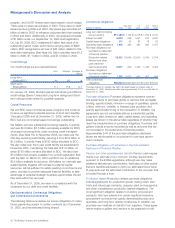
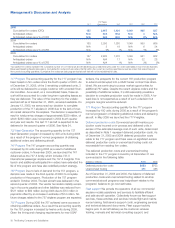
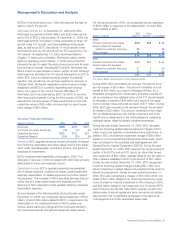
Support Systems
(Dollars in millions) 2005 2004 2003
Revenues $5,342 $4,881 $4,408
% of Total Company Revenues 10% 9% 9%
Operating Earnings $«««765 $«««662 $«««455
Operating Margins 14.3% 13.6% 10.3%
Research and Development $«««««80 $«««««57 $«««««59
Contractual Backlog $8,366 $6,505 $5,882
Unobligated Backlog $1,185 $1,573 $1,297
Revenues Support Systems revenues grew 9% from 2004 to
2005 due to increased volume in Integrated Support programs
such as C-17, F-15 Korea, AC-130, and CV-22, partially offset
by lower volume in Maintenance, Modification & Upgrade
(MM&U) programs like KC-135.
Revenues grew 11% from 2003 to 2004 due to increased vol-
ume in Supply Chain Services programs such as Apache
spares, Integrated Support programs like C-17, and Training &
Support Systems programs such as Fixed Wing and
Rotorcraft.
Operating Earnings Support Systems operating earnings grew
16% from 2004 to 2005 partly reflecting the revenue increase
mentioned above, partly due to continued performance
improvements in 2005 in Training & Support Systems, MM&U,
and Supply Chain Services programs and partly due to a 767
Tanker $18 million pre-tax write-off of pre-contract costs in
2004 due to a slip in the award of the USAF contract.
Earnings grew 45% from 2003 to 2004 primarily due to the sig-
nificant performance improvements from contract close-out
activities and lean initiatives in 2004 as well as the increased
revenue mentioned above, partially offset by the 2004 pre-tax
charge on the 767 Tanker program mentioned above.
Research and Development Support Systems continues to
focus investment strategies on its core businesses including
Engineering and Logistic Services, MM&U, Supply Chain
Services, Training and Support Systems, and Advanced
Logistics Services, as well as on moving into the innovative
Network Centric Logistics (NCL) areas. Investments have been
made to continue the development and implementation of
innovative and disciplined tools, processes and systems as
market discriminators in the delivery of integrated customer
solutions. Examples of successful programs stemming from
these investment strategies include the C-17 Globemaster
Sustainment partnership, the F/A-18 Integrated Readiness
Support Teaming (FIRST) program, and the F-15 Singapore
Performance Based Logistics contract.
Backlog Support Systems total backlog increased 18% from
2004 to 2005 primarily due to orders in Supply Chain Services
and Engineering and Logistics Services, partially offset by sales
throughout the segment.
Total backlog increased 13% from 2003 to 2004 primarily due
to orders in Life Cycle Customer Support programs, partially
offset by sales throughout the segment.
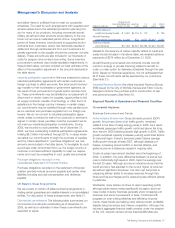
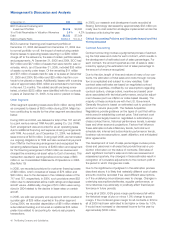
Launch & Orbital Systems
(Dollars in millions) 2005 2004 2003
Revenues $2,741 $«2,969 $«2,992
% of Total Company Revenues 5% 6% 6%
Operating Earnings $«««780 $«««(342) $(1,754)
Operating Margins 28.5% ÷(11.5)«% «« (58.6) %««
Research and Development $«««116 $««««161 $««««232
Contractual Backlog $2,586 $«4,200 $«3,934
Unobligated Backlog $2,252 $«2,403 $«2,184
Revenues L&OS revenues decreased 8% from 2004 to 2005
primarily due to launch slips caused by the strike by the IAM
and the Rocketdyne divestiture in 2005 and a favorable TFC
settlement on a commercial satellite program in 2004. This was
partially offset by higher contract values for Delta IV launch
contracts in 2005.
Revenues remained stable from 2003 to 2004 primarily due to
the favorable TFC settlement in 2004 mentioned above offset
by lower satellite and launch deliveries and milestone comple-
tions in 2004 compared to 2003.
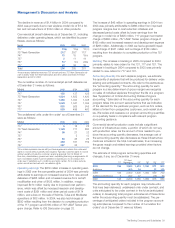
Deliveries of production units were as follows:
2005 2004 2003
Delta II 2 4 4
Delta IV 2
Commercial/Civil Satellites 3 2 3
Operating Earnings The L&OS operating earnings improvement
from 2004 to 2005 was driven by the net gains on the sale of
Rocketdyne $578 million, ($9 million of which was recognized
at the Other segment) and EDD ($25 million), gain from the sale
of a parcel of land at our Seal Beach, California facility, and
higher contract values for Delta IV launch contracts in 2005.
The operating losses recorded in 2004 were caused by per-
formance issues in the satellite business due to cost growth
from technical and quality issues and write-offs of slow moving
satellite inventory and also by cost growth on our Delta IV pro-
gram, partially offset by the favorable TFC settlement men-
tioned above.
The earnings improvement from 2003 to 2004 was primarily
driven by two significant events in 2003. First, a goodwill
impairment charge of $572 million was recorded in the first
quarter of 2003 as a result of an internal reorganization
whereby the SFAS No. 142 reportable segments, operating
segments, and reporting unit designations changed, causing
significantly different relationships between reporting unit carry-
ing values and fair values. Specifically, the new L&OS reporting
36 The Boeing Company and Subsidiaries