Boeing 2005 Annual Report Download - page 71
Download and view the complete annual report
Please find page 71 of the 2005 Boeing annual report below. You can navigate through the pages in the report by either clicking on the pages listed below, or by using the keyword search tool below to find specific information within the annual report.-
 1
1 -
2
-
3
-
4
-
5
-
6
-
7
-
8
-
9
-
10
-
11
-
12
-
13
-
14
-
15
-
16
-
17
-
18
-
19
-
20
-
21
-
22
-
23
-
24
-
25
-
26
-
27
-
28
-
29
-
30
-
31
-
32
-
33
-
34
-
35
-
36
-
37
-
38
-
39
-
40
-
41
-
42
-
43
-
44
-
45
-
46
-
47
-
48
-
49
-
50
-
51
-
52
-
53
-
54
-
55
-
56
-
57
-
58
-
59
-
60
-
 61
61 -
 62
62 -
 63
63 -
 64
64 -
 65
65 -
 66
66 -
 67
67 -
 68
68 -
 69
69 -
 70
70 -
 71
71 -
 72
72 -
 73
73 -
 74
74 -
 75
75 -
 76
76 -
 77
77 -
 78
78 -
 79
79 -
 80
80 -
 81
81 -
82
-
83
-
84
-
85
-
86
-
87
-
88
-
89
-
90
-
91
-
92
-
93
-
94
-
95
-
96
-
97
-
98
-
99
-
100
 |
 |

Notes to Consolidated Financial Statements
Settlement and curtailment losses/(gains) are primarily due to
divestitures. See Note 8.
The Medicare Prescription Drug, Improvement and
Modernization Act of 2003 reduced our APBO by $439 as of
September 30, 2004. On January 21, 2005, the Centers for
Medicare and Medicaid Services released final regulations
implementing the Medicare Prescription Drug, Improvement,
and Modernization Act of 2003. The final regulations provide for
greater flexibility in plan structuring and availability of direct fed-
eral subsidy for employer sponsored Medicare Health
Maintenance Organization (HMO) plans than originally antici-
pated, resulting in a reduction to our APBO of $156 at
September 30, 2005. These reductions/actuarial gains are
amortized over the expected average future service of current
employees.
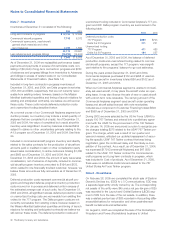
Assumptions
At September 30, 2005 2004 2003 2002
Discount rate: pension and OPB 5.50% 5.75% 6.00% 6.50%
Expected return on plan assets 8.50% 8.50% 8.75% 9.00%
Rate of compensation increase 5.50% 5.50% 5.50% 5.50%
In 2005, we modified our method of determining the discount
rate. The key change in method is that the discount rate for
each individual pension plan will be determined separately
based on the duration of each plan’s liabilities. Prior to 2005 we
determined a single discount rate applicable to all our postre-
tirement benefit plans. The method change was largely attribut-
able to divergence in the characteristics of the populations of
our various plans over the last few years resulting from
changes within the company and between the plans, including
transfers, layoffs and divestitures. The new method continues
to include a matching of the plans’ expected future benefit pay-
ments against a yield curve developed using all high quality,
non-callable bonds in the Bloomberg index as of the measure-
ment date, omitting bonds with the ten percent highest and the
ten percent lowest yields. The disclosed rate is the average
rate for all the plans, weighted by the projected benefit obliga-
tion. As of September 30, 2005, the weighted average was
5.50%, and the rates for individual plans ranged from 5.00% to
6.00%.
The pension fund’s expected return on assets assumption is
derived from an extensive study conducted by our Trust
Investments group and its actuaries on a periodic basis. The
study includes a review of actual historical returns achieved by
the pension trust and anticipated future long-term performance
of individual asset classes with consideration given to the
related investment strategy. While the study gives appropriate
consideration to recent trust performance and historical
returns, the assumption represents a long-term prospective
return. The expected return on plan assets determined on each
measurement date is used to calculate the net periodic benefit
cost/(income) for the upcoming plan year.
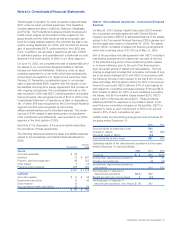
At September 30, 2005 2004
Assumed health care cost trend rates
Health care cost trend rate assumed next year 9.00% 9.00%
Ultimate trend rate 5.00% 5.00%
Year that trend reached ultimate rate 2013 2009
Assumed health care cost trend rates have a significant effect
on the amounts reported for the health care plans. To deter-
mine the health care cost trend rates we look at a combination
of information including ongoing claims cost monitoring, annual
statistical analyses of claims data, reconciliation of forecast
claims against actual claims, review of trend assumptions of
other plan sponsors and national health trends, and adjust-
ments for plan design changes, workforce changes, and
changes in plan participant behavior. A one-percentage-point
change in assumed health care cost trend rates would have
the following effect:
1-Percentage 1-Percentage
Point Point
Increase Decrease
Effect on postretirement benefit obligation $712 $(624)
Effect on total of service and interest cost 62 (53)
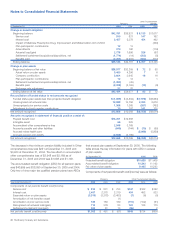
Plan Assets
Pension assets totaled $43,484 and $38,977 at September 30,
2005 and 2004. Pension assets are allocated with a goal to
achieve diversification between and within various asset
classes. Pension investment managers are retained with a spe-
cific investment role and corresponding investment guidelines.
Investment managers have the ability to purchase securities on
behalf of the pension fund, and several of them have permis-
sion to invest in derivatives, such as equity or bond futures.
Derivatives are sometimes used to achieve the equivalent mar-
ket exposure of owning a security or to rebalance the total
portfolio to the target asset allocation. Derivatives are more
cost-effective investment alternatives when compared to own-
ing the corresponding security. In the instances in which deriva-
tives are used, cash balances must be maintained at a level
equal to the notional exposure of the derivatives.
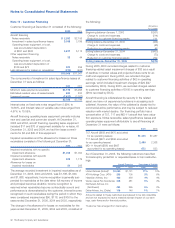
The actual allocations for the pension assets at September 30,
2005 and 2004, and target allocations by asset category, are
as follows:
Percentage of Plan Assets Target
at September 30, Allocations
Asset Category 2005 2004 2005 2004
Equity 61% 60% 50% 50%
Debt 31 32 31 31
Real estate 3 3 6 6
Other 5 5 13 13
100% 100% 100% 100%
Equity includes domestic and international equity securities,
such as common, preferred or other capital stock, as well as
equity futures, currency forwards and residual cash allocated to
the equity managers. Equity includes our common stock in the
amounts of $1,494 (3.38% of plan assets) and $1,613 (4.19%
of plan assets) at September 30, 2005 and 2004. Equity deriv-
atives based on net notional amounts totaled 2.5% and 3.0%
The Boeing Company and Subsidiaries 69