Boeing 2005 Annual Report Download - page 42
Download and view the complete annual report
Please find page 42 of the 2005 Boeing annual report below. You can navigate through the pages in the report by either clicking on the pages listed below, or by using the keyword search tool below to find specific information within the annual report.-
 1
1 -
2
-
3
-
4
-
5
-
6
-
7
-
8
-
9
-
10
-
11
-
12
-
13
-
14
-
15
-
16
-
17
-
18
-
19
-
20
-
21
-
22
-
23
-
24
-
25
-
26
-
27
-
28
-
29
-
30
-
31
-
 32
32 -
 33
33 -
 34
34 -
 35
35 -
 36
36 -
 37
37 -
 38
38 -
 39
39 -
 40
40 -
 41
41 -
 42
42 -
 43
43 -
 44
44 -
 45
45 -
 46
46 -
 47
47 -
 48
48 -
 49
49 -
 50
50 -
 51
51 -
 52
52 -
53
-
54
-
55
-
56
-
57
-
58
-
59
-
60
-
61
-
62
-
63
-
64
-
65
-
66
-
67
-
68
-
69
-
70
-
71
-
72
-
73
-
74
-
75
-
76
-
77
-
78
-
79
-
80
-
81
-
82
-
83
-
84
-
85
-
86
-
87
-
88
-
89
-
90
-
91
-
92
-
93
-
94
-
95
-
96
-
97
-
98
-
99
-
100
 |
 |

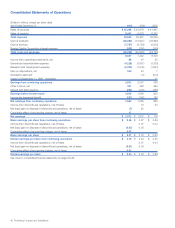
Management’s Discussion and Analysis
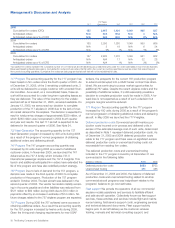
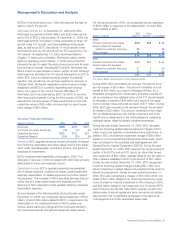
At December 31, 2005 2004
BCC Customer Financing and
Investment Portfolio $9,206 $9,680
% of Total Receivables in Valuation Allowance 2.0% 4.2%
Debt $6,322 $7,024
Debt-to-Equity Ratio 5.0-to-1 5.0-to-1
BCC’s customer financing and investment portfolio at
December 31, 2005 decreased from December 31, 2004 due
to normal portfolio run-off, the impact of restructuring certain
finance leases to operating leases resulting in a $200 million
charge-off to the allowance, the sale of certain portfolio assets,
and prepayments. At December 31, 2005 and 2004, BCC had
$47 million and $37 million of assets that were held for sale or
re-lease, which, as of December 31, 2005, included $36 million
of assets currently under lease. Of the remaining $11 million
and $37 million of assets held for sale or re-lease at December
31, 2005 and 2004, $6 million and $25 million had firm con-
tracts to be placed on lease. Additionally, leases with a carrying
value of approximately $363 million are scheduled to terminate
in the next 12 months. The related aircraft are being remar-
keted, of which $238 million were identified with firm contracts
in place at December 31, 2005, to be sold or placed on lease.
Other Segment
Other segment operating losses were $334 million during 2005
as compared to losses of $535 million during 2004. Major fac-
tors contributing to results for the other segment are described
below.
During 2003 and 2004, we delivered a total of five 767 aircraft
to a joint venture named TRM Aircraft Leasing Co. Ltd. (TRM).
Such arrangement was accounted for as an operating lease
due to additional financing and expense sharing arrangements
with TRM. As a result, as of December 31, 2004, we deferred
lease income of $379 million. During April 2005, we terminated
our ongoing obligations to TRM and also received full payment
from TRM for the financing arrangement and recognized the
remaining deferred lease income of $369 million and repayment
for the financing arrangement of $42 million as revenue and
charged the remaining net asset value to Cost of services. This
transaction resulted in earnings before income taxes of $63
million in our Consolidated Statements of Operations in 2005.
(See Note 15)
In 2005, we recorded provisions for customer financing losses
of $98 million, which consisted of losses of $76 million and
$22 million, due to the decrease in the collateral values of the
717 and 757, respectively. In 2004, such provisions were $82
million due to deteriorated airline credit ratings and depressed
aircraft values. Additionally, charges of $13 million were recog-
nized in 2004 related to the decline in lease rates on certain
aircraft.
In 2005, we sold real property and equipment which resulted in
a pretax gain of $29 million reported in the other segment.
During 2004, we recorded depreciation of $61 million related to
a demolished building and incurred an additional $18 million
pretax loss related to accounting for various real property
transactions.
In 2005, our research and development costs recorded at
Boeing Technology decreased by approximately $32 million pri-
marily due to cost reduction strategies implemented across the
business units during the year.
Critical Accounting Policies and Standards Issued and Not
Yet Implemented
Contract Accounting
Contract accounting involves a judgmental process of estimat-
ing the total sales and costs for each contract, which results in
the development of estimated cost of sales percentages. For
each contract, the amount reported as cost of sales is deter-
mined by applying the estimated cost of sales percentage to
the amount of revenue recognized.
Due to the size, length of time and nature of many of our con-
tracts, the estimation of total sales and costs through comple-
tion is complicated and subject to many variables. Total
contract sales estimates are based on negotiated contract
prices and quantities, modified by our assumptions regarding
contract options, change orders, incentive and award provi-
sions associated with technical performance, and price adjust-
ment clauses (such as inflation or index-based clauses). The
majority of these contracts are with the U.S. Government.
Generally the price is based on estimated cost to produce the
product or service plus profit. The Federal Acquisition
Regulations provide guidance on the types of cost that will be
reimbursed in establishing contract price. Total contract cost
estimates are largely based on negotiated or estimated pur-
chase contract terms, historical performance trends, business
base and other economic projections. Factors that influence
these estimates include inflationary trends, technical and
schedule risk, internal and subcontractor performance trends,
business volume assumptions, asset utilization, and anticipated
labor agreements.
The development of cost of sales percentages involves proce-
dures and personnel in all areas that provide financial or pro-
duction information on the status of contracts. Estimates of
each significant contract’s sales and costs are reviewed and
reassessed quarterly. Any changes in these estimates result in
recognition of cumulative adjustments to the contract profit in
the period in which changes are made.
Due to the significance of judgment in the estimation process
described above, it is likely that materially different cost of sales
amounts could be recorded if we used different assumptions,
or if the underlying circumstances were to change. Changes in
underlying assumptions/estimates, supplier performance, or
circumstances may adversely or positively affect financial per-
formance in future periods.
During all of 2005, IDS’s gross margin performance fell within
the historical range of plus or minus 1.0% change to gross
margin. If the combined gross margin for all contracts in IDS for
all of 2005 had been estimated to be higher or lower by 1.0%,
it would have increased or decreased income for the year by
approximately $308 million.
40 The Boeing Company and Subsidiaries