Boeing 2005 Annual Report Download - page 27
Download and view the complete annual report
Please find page 27 of the 2005 Boeing annual report below. You can navigate through the pages in the report by either clicking on the pages listed below, or by using the keyword search tool below to find specific information within the annual report.-
 1
1 -
2
-
3
-
4
-
5
-
6
-
7
-
8
-
9
-
10
-
11
-
12
-
13
-
14
-
15
-
16
-
 17
17 -
 18
18 -
 19
19 -
 20
20 -
 21
21 -
 22
22 -
 23
23 -
 24
24 -
 25
25 -
 26
26 -
 27
27 -
 28
28 -
 29
29 -
 30
30 -
 31
31 -
 32
32 -
 33
33 -
 34
34 -
 35
35 -
 36
36 -
 37
37 -
38
-
39
-
40
-
41
-
42
-
43
-
44
-
45
-
46
-
47
-
48
-
49
-
50
-
51
-
52
-
53
-
54
-
55
-
56
-
57
-
58
-
59
-
60
-
61
-
62
-
63
-
64
-
65
-
66
-
67
-
68
-
69
-
70
-
71
-
72
-
73
-
74
-
75
-
76
-
77
-
78
-
79
-
80
-
81
-
82
-
83
-
84
-
85
-
86
-
87
-
88
-
89
-
90
-
91
-
92
-
93
-
94
-
95
-
96
-
97
-
98
-
99
-
100
 |
 |

Management’s Discussion and Analysis
Liquidity and Capital Resources
The primary sources of our liquidity and capital resources
include cash flow from operations and substantial unused
borrowing capacity through commercial paper programs,
long-term capital markets and revolving credit line agreements.
The primary factors that affect our investment requirements
and liquidity position, other than operating results associated
with current sales activity, include the following: timing of new
and derivative aircraft programs requiring both high develop-
mental expenditures and initial inventory buildup; growth and
contractions in business cycles; customer financing assistance;
the timing of federal income tax payments/refunds and contri-
butions to our pension plans as well as interest, debt and divi-
dend payments; our stock repurchase plan; internal
investments; and acquisitions and divestitures.
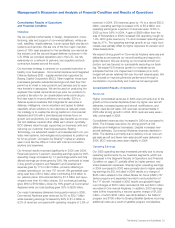
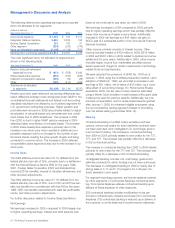
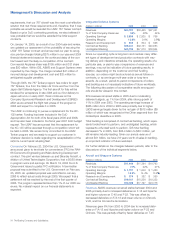
Cash Flow Summary
(Dollars in millions)
Year ended December 31, 2005 2004 2003
Net earnings $«2,572 $«1,872 $««««718
Non-cash items 3,310 3,047 3,137
Changes in working capital 1,118 (1,415) (1,079)
Net cash provided by
operating activities 7,000 3,504 2,776
Net cash (used)/provided by
investing activities (98) (1,446) 60
Net cash used by
financing activities (4,657) (3,487) (536)
Effect of exchange rate changes
on cash and cash equivalents (37)
Net increase/(decrease) in cash
and cash equivalents
Cash and cash equivalents
at beginning of year
Cash and cash equivalents
at end of year
2,208
3,204
$«5,412
(1,429)
4,633
$«3,204
2,300
2,333
$«4,633
Non-cash items Non-cash items in earnings primarily include
depreciation, share-based plans expense, impairments, pen-
sion expense, and gains/losses on dispositions. Corresponding
amounts are listed in our Consolidated Statements of Cash
Flows.
Working capital During the year ended December 31, 2005,
our investment in working capital decreased. This decrease is
primarily due to the following:
� lower pension contributions in 2005 compared to 2004,
� decreased investment in customer financing, and
� higher advances and billings in excess of related costs.
These decreases in working capital were partially offset by
increased investment in inventories.
Working capital includes customer financing transactions pri-
marily in the form of notes receivable, sales-type/finance leases
and property subject to operating leases. These transactions
occur as the result of customer financing activities associated
with items recorded in inventory. The origination and subse-
quent principal collections for some of these transactions were
previously presented as investing activities in our Consolidated
Statements of Cash Flows, consistent with the presentation by
BCC in their stand alone financial statements. Effective for the
year ended December 31, 2004, we changed the classification
of the cash flow effects of customer financing transactions
based on views expressed by the Securities and Exchange
Commission (SEC) staff. The amounts for prior periods have
been reclassified to be consistent with current year presenta-
tion. For the years ended December 31, 2005, 2004 and 2003,
the net impact on operating cash flow was $589 million, ($421)
million and ($1.3) billion, respectively, for customer financing
transactions.
During the year ended December 31, 2005, we received fed-
eral income tax refunds totaling $738 million (of which $145
million represents interest). These refunds related to the settle-
ment of federal income tax audits for the 1987-2001 tax years.
For the years ended December 31, 2005 and 2004, we con-
tributed $1.9 billion and $4.4 billion to our pension plans which
are included in operating cash flow. Almost all of the 2005 and
2004 contributions were voluntary to improve the funded status
of our plans.
Investing activities In 2005, cash used for investing activities
decreased by $1.3 billion compared to 2004. The decrease
was primarily due to higher net contributions in 2004 to invest-
ment grade fixed income securities partially offset by lower pro-
ceeds from business dispositions in 2005 and higher Property,
plant and equipment additions in 2005.
During 2004, we invested $3.0 billion of cash in an externally
managed portfolio of investment grade fixed income instru-
ments. The portfolio is diversified and highly liquid and primarily
consists of investment fixed income instruments (U.S. dollar
debt obligations of the United States Treasury, other govern-
ment agencies, corporations, mortgage-backed and asset-
backed securities). As of December 31, 2005, the portfolio had
an average duration of 1.6 years. We do not intend to hold
these investments to maturity, nor do we intend to actively and
frequently buy and sell these securities with the objective of
generating profits on short-term differences in price.
During 2005, we received $1.7 billion of cash proceeds from
dispositions. This is primarily related to the sale of our
Commercial Airplanes operations in Wichita, Kansas, and Tulsa
and McAlester, Oklahoma and the sale of Rocketdyne. During
2004, we received cash of $2.0 billion from the sale of a sub-
stantial portion of BCC’s Commercial Financial Services busi-
ness. Property, plant and equipment additions increased by
approximately $0.3 billion to $1.5 billion in 2005.
Financing activities Cash used by financing activities increased
to $4.6 billion in 2005 from $3.5 billion in 2004 primarily due to
a $2.1 billion increase in share repurchases partially offset by
lower debt repayments.
During 2005, we repurchased 45,217,300 shares at an aver-
age price of $63.60 pursuant to our open market share repur-
chase program, and 33,360 shares in stock swaps. During
2004, 14,708,856 shares were repurchased at an average
price of $51.09 pursuant to our open market share repurchase
The Boeing Company and Subsidiaries 25