Xerox 2006 Annual Report Download - page 90
Download and view the complete annual report
Please find page 90 of the 2006 Xerox annual report below. You can navigate through the pages in the report by either clicking on the pages listed below, or by using the keyword search tool below to find specific information within the annual report.-
 1
1 -
2
-
3
-
4
-
5
-
6
-
7
-
8
-
9
-
10
-
11
-
12
-
13
-
14
-
15
-
16
-
17
-
18
-
19
-
20
-
21
-
22
-
23
-
24
-
25
-
26
-
27
-
28
-
29
-
30
-
31
-
32
-
33
-
34
-
35
-
36
-
37
-
38
-
39
-
40
-
41
-
42
-
43
-
44
-
45
-
46
-
47
-
48
-
49
-
50
-
51
-
52
-
53
-
54
-
55
-
56
-
57
-
58
-
59
-
60
-
61
-
62
-
63
-
64
-
65
-
66
-
67
-
68
-
69
-
70
-
71
-
72
-
73
-
74
-
75
-
76
-
77
-
78
-
79
-
 80
80 -
 81
81 -
 82
82 -
 83
83 -
 84
84 -
 85
85 -
 86
86 -
 87
87 -
 88
88 -
 89
89 -
 90
90 -
 91
91 -
 92
92 -
 93
93 -
 94
94 -
 95
95 -
 96
96 -
 97
97 -
 98
98 -
 99
99 -
 100
100 -
101
-
102
-
103
-
104
-
105
-
106
-
107
-
108
-
109
-
110
-
111
-
112
-
113
-
114
-
115
-
116
 |
 |

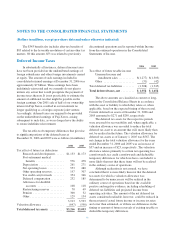
NOTES TO THE CONSOLIDATED FINANCIAL STATEMENTS
(Dollars in millions, except per-share data and unless otherwise indicated)
measures that address both return and risk. The
investment portfolio contains a diversified blend of equity
and fixed income investments. Furthermore, equity
investments are diversified across U.S and non-U.S.
stocks as well as growth, value, and small and large
capitalizations. Other assets such as real estate, private
equity, and hedge funds are used to improve portfolio
diversification. Derivatives may be used to hedge market
exposure in an efficient and timely manner; however,
derivatives may not be used to leverage the portfolio
beyond the market value of the underlying investments.
Investment risks and returns are measured and monitored
on an ongoing basis through annual liability
measurements and quarterly investment portfolio
reviews.
Expected Long Term Rate of Return: We employ
a “building block” approach in determining the long-term
rate of return for plan assets. Historical markets are
studied and long-term relationships between equities and
fixed income are assessed. Current market factors such as
inflation and interest rates are evaluated before long-term
capital market assumptions are determined. The long-
term portfolio return is established giving consideration
to investment diversification and rebalancing. Peer data
and historical returns are reviewed periodically to assess
reasonableness and appropriateness.
Contributions: We expect to contribute
approximately $130 to our worldwide defined benefit
pension plans and approximately $100 to our other post
retirement benefit plans in 2007. The 2007 expected
pension plan contributions do not include any planned
contribution for our domestic tax-qualified plans because
there are no required contributions to these plans for the
2007 fiscal year. However, once the January 1, 2007
actuarial valuations and projected results as of the end of
the 2007 measurement year are available, the desirability
of additional contributions will be reassessed. Based on
these results, we may voluntarily decide to contribute to
these plans, even though no contribution is required. In
2006 and 2005, after making this assessment, we decided
to contribute $228 and $230, respectively, to our
domestic tax qualified plans in order to make them 100%
funded on a current liability basis under the ERISA
funding rules. In addition, our debt ratings, which are
periodically reviewed by major rating agencies, have
steadily improved over the past three years. Since the
rating on the Company’s senior unsecured debt has now
reached investment grade, the Company will have
increased flexibility when considering these funding
decisions.
In 2006, the Pension Protection Act of 2006 (the
“Act”) was enacted into law. The Act alters the manner in
which liabilities and asset values are determined for the
purpose of calculating required pension contributions and
the timing and manner in which required contributions to
under-funded pension plans would be made. While we
are still evaluating the Act, at this time we do not expect
it to have any significant effect on our current funding
strategy for our U.S. pension plans. In the past, our
strategy has been to be fully funded on a current liability
basis.
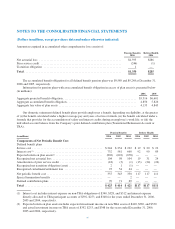
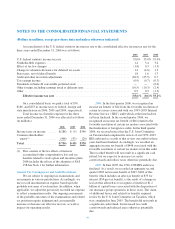
Estimated Future Benefit Payments: The
following benefit payments, which reflect expected future
service, as appropriate, are expected to be paid (in
millions):
Pension
Benefits
Retiree
Health
2007 ........................... $ 688 $ 102
2008 ........................... 561 115
2009 ........................... 617 123
2010 ........................... 687 127
2011 ........................... 674 128
Years 2012-2016 ................. 3,586 665
Assumptions
Pension Benefits Retiree Health
2006 2005 2004 2006 2005 2004
Weighted-average assumptions used to determine benefit obligations
at the plan measurement dates
Discount rate ................................................ 5.3% 5.2% 5.6% 5.8% 5.6% 5.8%
Rate of compensation increase .................................. 4.1 3.9 4.0 — (1) —(1) —(1)
(1) Rate of compensation increase is not applicable to our other benefits as compensation levels do not impact earned
benefits.
88