Xerox 2006 Annual Report Download - page 67
Download and view the complete annual report
Please find page 67 of the 2006 Xerox annual report below. You can navigate through the pages in the report by either clicking on the pages listed below, or by using the keyword search tool below to find specific information within the annual report.-
 1
1 -
2
-
3
-
4
-
5
-
6
-
7
-
8
-
9
-
10
-
11
-
12
-
13
-
14
-
15
-
16
-
17
-
18
-
19
-
20
-
21
-
22
-
23
-
24
-
25
-
26
-
27
-
28
-
29
-
30
-
31
-
32
-
33
-
34
-
35
-
36
-
37
-
38
-
39
-
40
-
41
-
42
-
43
-
44
-
45
-
46
-
47
-
48
-
49
-
50
-
51
-
52
-
53
-
54
-
55
-
56
-
 57
57 -
 58
58 -
 59
59 -
 60
60 -
 61
61 -
 62
62 -
 63
63 -
 64
64 -
 65
65 -
 66
66 -
 67
67 -
 68
68 -
 69
69 -
 70
70 -
 71
71 -
 72
72 -
 73
73 -
 74
74 -
 75
75 -
 76
76 -
 77
77 -
78
-
79
-
80
-
81
-
82
-
83
-
84
-
85
-
86
-
87
-
88
-
89
-
90
-
91
-
92
-
93
-
94
-
95
-
96
-
97
-
98
-
99
-
100
-
101
-
102
-
103
-
104
-
105
-
106
-
107
-
108
-
109
-
110
-
111
-
112
-
113
-
114
-
115
-
116
 |
 |

NOTES TO THE CONSOLIDATED FINANCIAL STATEMENTS
(Dollars in millions, except per-share data and unless otherwise indicated)
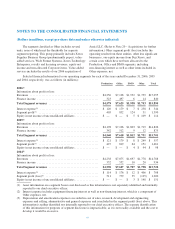
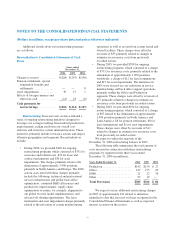
The following is a reconciliation of segment profit to pre-tax income (in millions):
Years ended December 31,
2006 2005 2004
Total Segment profit ..................................................... $1,390 $1,461 $1,200
Reconciling items:
Restructuring and asset impairment charges ............................... (385) (366) (86)
Provisions for litigation matters(1) ....................................... (68) (114) —
Initial provision for WEEE Directive ..................................... — (26) —
Hurricane Katrina adjustments (losses) ................................... 8 (15) —
Other expenses, net ................................................... (23) (12) 2
Equity in net income of unconsolidated affiliates ........................... (114) (98) (151)
Pre-tax income ......................................................... $ 808 $ 830 $ 965
(1) 2006 provision for litigation includes $68 related to probable losses on Brazilian labor-related contingencies. 2005
provision for litigation primarily includes $102 related to MPI arbitration panel ruling. Refer to Note 16 –
Contingencies for further discussion relating to the 2006 and 2005 annual periods.
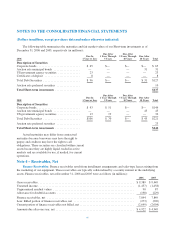
Geographic area data was as follows:
Revenues Long-Lived Assets(1)
(in millions) 2006 2005 2004 2006 2005 2004
United States ..................................... $ 8,406 $ 8,388 $ 8,346 $1,309 $1,386 $1,427
Europe .......................................... 5,378 5,226 5,281 572 500 585
Other Areas ...................................... 2,111 2,087 2,095 356 386 434
Total ........................................... $15,895 $15,701 $15,722 $2,237 $2,272 $2,446
(1) Long-lived assets are comprised of (i) land, buildings and equipment, net, (ii) equipment on operating leases, net,
(iii) internal use software, net and (iv) capitalized software costs, net.
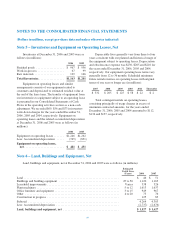
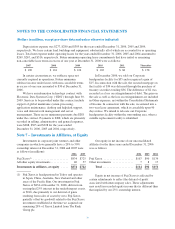
Note 3 – Short-Term Investments
As of December 31, 2006 and 2005, respectively, we
held $137 and $244 in marketable securities that are
classified within Short-term investments in our
Consolidated Balance Sheets. These securities are
considered available-for-sale and are carried at fair value
based on quoted market prices. Unrealized gains and
losses, net of taxes, are less than $1 and are recorded
within Accumulated other comprehensive loss, a
component of Common shareholders’ equity. The cost of
securities sold is based on the specific identification
method. Gains or losses of less than $1 million were
realized on these sales for the years ended December 31,
2006 and 2005, respectively.
65