Xerox 2006 Annual Report Download - page 52
Download and view the complete annual report
Please find page 52 of the 2006 Xerox annual report below. You can navigate through the pages in the report by either clicking on the pages listed below, or by using the keyword search tool below to find specific information within the annual report.-
 1
1 -
2
-
3
-
4
-
5
-
6
-
7
-
8
-
9
-
10
-
11
-
12
-
13
-
14
-
15
-
16
-
17
-
18
-
19
-
20
-
21
-
22
-
23
-
24
-
25
-
26
-
27
-
28
-
29
-
30
-
31
-
32
-
33
-
34
-
35
-
36
-
37
-
38
-
39
-
40
-
41
-
 42
42 -
 43
43 -
 44
44 -
 45
45 -
 46
46 -
 47
47 -
 48
48 -
 49
49 -
 50
50 -
 51
51 -
 52
52 -
 53
53 -
 54
54 -
 55
55 -
 56
56 -
 57
57 -
 58
58 -
 59
59 -
 60
60 -
 61
61 -
 62
62 -
63
-
64
-
65
-
66
-
67
-
68
-
69
-
70
-
71
-
72
-
73
-
74
-
75
-
76
-
77
-
78
-
79
-
80
-
81
-
82
-
83
-
84
-
85
-
86
-
87
-
88
-
89
-
90
-
91
-
92
-
93
-
94
-
95
-
96
-
97
-
98
-
99
-
100
-
101
-
102
-
103
-
104
-
105
-
106
-
107
-
108
-
109
-
110
-
111
-
112
-
113
-
114
-
115
-
116
 |
 |

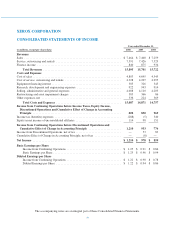
XEROX CORPORATION
CONSOLIDATED STATEMENTS OF INCOME
Year ended December 31,
(in millions, except per-share data) 2006 2005 2004
Revenues
Sales .................................................................. $ 7,464 $ 7,400 $ 7,259
Service, outsourcing and rentals ............................................ 7,591 7,426 7,529
Finance income ......................................................... 840 875 934
Total Revenues ..................................................... 15,895 15,701 15,722
Costs and Expenses
Cost of sales ............................................................ 4,803 4,695 4,545
Cost of service, outsourcing and rentals ...................................... 4,328 4,207 4,295
Equipment financing interest ............................................... 305 326 345
Research, development and engineering expenses .............................. 922 943 914
Selling, administrative and general expenses .................................. 4,008 4,110 4,203
Restructuring and asset impairment charges ................................... 385 366 86
Other expenses, net ...................................................... 336 224 369
Total Costs and Expenses ............................................ 15,087 14,871 14,757
Income from Continuing Operations before Income Taxes, Equity Income,
Discontinued Operations and Cumulative Effect of Change in Accounting
Principle ............................................................ 808 830 965
Income tax (benefits) expenses ............................................. (288) (5) 340
Equity in net income of unconsolidated affiliates ............................... 114 98 151
Income from Continuing Operations before Discontinued Operations and
Cumulative Effect of Change in Accounting Principle ...................... 1,210 933 776
Income from Discontinued Operations, net of tax ............................... — 53 83
Cumulative Effect of Change in Accounting Principle, net of tax .................. — (8) —
Net Income ............................................................ $ 1,210 $ 978 $ 859
Basic Earnings per Share
Income from Continuing Operations ..................................... $ 1.25 $ 0.91 $ 0.84
Basic Earnings per Share .............................................. $ 1.25 $ 0.96 $ 0.94
Diluted Earnings per Share
Income from Continuing Operations ..................................... $ 1.22 $ 0.90 $ 0.78
Diluted Earnings per Share ............................................ $ 1.22 $ 0.94 $ 0.86
The accompanying notes are an integral part of these Consolidated Financial Statements.
50