Xerox 2006 Annual Report Download - page 104
Download and view the complete annual report
Please find page 104 of the 2006 Xerox annual report below. You can navigate through the pages in the report by either clicking on the pages listed below, or by using the keyword search tool below to find specific information within the annual report.-
 1
1 -
2
-
3
-
4
-
5
-
6
-
7
-
8
-
9
-
10
-
11
-
12
-
13
-
14
-
15
-
16
-
17
-
18
-
19
-
20
-
21
-
22
-
23
-
24
-
25
-
26
-
27
-
28
-
29
-
30
-
31
-
32
-
33
-
34
-
35
-
36
-
37
-
38
-
39
-
40
-
41
-
42
-
43
-
44
-
45
-
46
-
47
-
48
-
49
-
50
-
51
-
52
-
53
-
54
-
55
-
56
-
57
-
58
-
59
-
60
-
61
-
62
-
63
-
64
-
65
-
66
-
67
-
68
-
69
-
70
-
71
-
72
-
73
-
74
-
75
-
76
-
77
-
78
-
79
-
80
-
81
-
82
-
83
-
84
-
85
-
86
-
87
-
88
-
89
-
90
-
91
-
92
-
93
-
 94
94 -
 95
95 -
 96
96 -
 97
97 -
 98
98 -
 99
99 -
 100
100 -
 101
101 -
 102
102 -
 103
103 -
 104
104 -
 105
105 -
 106
106 -
 107
107 -
 108
108 -
 109
109 -
 110
110 -
 111
111 -
 112
112 -
 113
113 -
 114
114 -
115
-
116
 |
 |

NOTES TO THE CONSOLIDATED FINANCIAL STATEMENTS
(Dollars in millions, except per-share data and unless otherwise indicated)
At December 31, 2006, the aggregate intrinsic value
of RSUs outstanding was $147. The total intrinsic value
of RSUs vested during 2006, 2005 and 2004 was $10, $13
and $26, respectively. The actual tax benefit realized for
the tax deductions for vested RSUs totaled $3, $4 and $9
for the years ended December 31, 2006, 2005 and 2004,
respectively.
At December 31, 2006, there was $65 of total
unrecognized compensation cost related to nonvested
RSUs, which is expected to be recognized ratably over a
remaining weighted-average contractual term of 1.7
years.
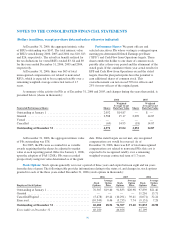
Performance Shares: We grant officers and
selected executives PSs whose vesting is contingent upon
meeting pre-determined Diluted Earnings per Share
(“EPS”) and Cash Flow from Operations targets. These
shares entitle the holder to one share of common stock,
payable after a three-year period and the attainment of the
stated goals. If the cumulative three-year actual results for
EPS and Cash Flow from Operations exceed the stated
targets, then the plan participants have the potential to
earn additional shares of common stock. This
overachievement can not exceed 50% for officers and
25% for non-officers of the original grant.
A summary of the activity for PSs as of December 31, 2006 and 2005, and changes during the years then ended, is
presented below (shares in thousands):
2006 2005
Nonvested Performance Shares Shares
Weighted
Average Grant
Date Fair Value Shares
Weighted
Average Grant
Date Fair Value
Outstanding at January 1 .................................... 2,052 $14.87 — $ —
Granted .................................................. 2,588 15.17 2,070 14.87
Vested ................................................... — — — —
Cancelled ................................................ (69) 14.95 (18) 14.87
Outstanding at December 31 ................................ 4,571 15.04 2,052 14.87
At December 31, 2006, the aggregate intrinsic value
of PSs outstanding was $78.
For 2005, the PSs were accounted for as variable
awards requiring that the shares be adjusted to market
value at each reporting period. Effective January 1, 2006,
upon the adoption of FAS 123(R), PSs were recorded
prospectively using fair value determined as of the grant
date. If the stated targets are not met, any recognized
compensation cost would be reversed. As of
December 31, 2006, there was $47 of total unrecognized
compensation cost related to nonvested PSs; this cost is
expected to be recognized ratably over a remaining
weighted-average contractual term of 1.7 years.
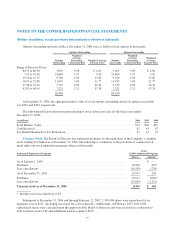
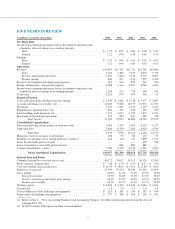
Stock Options: Stock options generally vest over a period of three years and expire between eight and ten years
from the date of grant. The following table provides information relating to the status of, and changes in, stock options
granted for each of the three years ended December 31, 2006 (stock options in thousands):
2006 2005 2004
Employee Stock Options
Stock
Options
Average
Option
Price
Stock
Options
Average
Option
Price
Stock
Options
Average
Option
Price
Outstanding at January 1 ............................. 76,307 $19.40 91,833 $20.98 97,839 $21.46
Granted .......................................... — — — — 11,216 13.71
Cancelled/Expired .................................. (5,478) 49.44 (10,291) 39.41 (8,071) 32.24
Exercised ......................................... (10,349) 8.46 (5,235) 7.74 (9,151) 7.28
Outstanding at December 31 ........................ 60,480 18.56 76,307 19.40 91,833 20.98
Exercisable at December 31 .......................... 60,180 66,928 65,199
102