Xerox 2006 Annual Report Download - page 88
Download and view the complete annual report
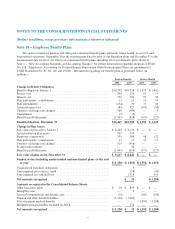
Please find page 88 of the 2006 Xerox annual report below. You can navigate through the pages in the report by either clicking on the pages listed below, or by using the keyword search tool below to find specific information within the annual report.-
 1
1 -
2
-
3
-
4
-
5
-
6
-
7
-
8
-
9
-
10
-
11
-
12
-
13
-
14
-
15
-
16
-
17
-
18
-
19
-
20
-
21
-
22
-
23
-
24
-
25
-
26
-
27
-
28
-
29
-
30
-
31
-
32
-
33
-
34
-
35
-
36
-
37
-
38
-
39
-
40
-
41
-
42
-
43
-
44
-
45
-
46
-
47
-
48
-
49
-
50
-
51
-
52
-
53
-
54
-
55
-
56
-
57
-
58
-
59
-
60
-
61
-
62
-
63
-
64
-
65
-
66
-
67
-
68
-
69
-
70
-
71
-
72
-
73
-
74
-
75
-
76
-
77
-
 78
78 -
 79
79 -
 80
80 -
 81
81 -
 82
82 -
 83
83 -
 84
84 -
 85
85 -
 86
86 -
 87
87 -
 88
88 -
 89
89 -
 90
90 -
 91
91 -
 92
92 -
 93
93 -
 94
94 -
 95
95 -
 96
96 -
 97
97 -
 98
98 -
99
-
100
-
101
-
102
-
103
-
104
-
105
-
106
-
107
-
108
-
109
-
110
-
111
-
112
-
113
-
114
-
115
-
116
 |
 |

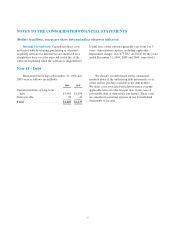
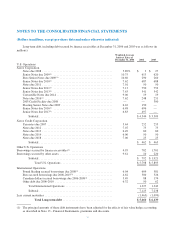
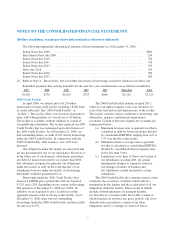
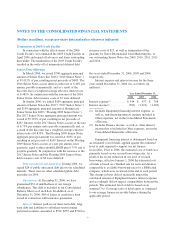
NOTES TO THE CONSOLIDATED FINANCIAL STATEMENTS
(Dollars in millions, except per-share data and unless otherwise indicated)
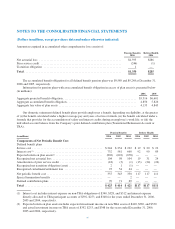
Amounts recognized in accumulated other comprehensive loss consist of:
Pension Benefits
2006
Retiree Health
2006
Net actuarial loss ........................................................ $1,595 $286
Prior service credit ....................................................... (246) (1)
Transition obligation ..................................................... 1 —
Total .................................................................. $1,350 $285
The accumulated benefit obligation for all defined benefit pension plans was $9,589 and $9,248 at December 31,
2006 and 2005, respectively.
Information for pension plans with an accumulated benefit obligation in excess of plan assets is presented below
(in millions): 2006 2005
Aggregate projected benefit obligation .................................................. $5,316 $6,601
Aggregate accumulated benefit obligation ............................................... 4,856 5,826
Aggregate fair value of plan assets ..................................................... 4,133 4,845
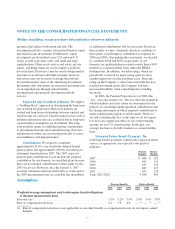
Our domestic retirement defined benefit plans provide employees a benefit, depending on eligibility, at the greater
of (i) the benefit calculated under a highest average pay and years of service formula, (ii) the benefit calculated under a
formula that provides for the accumulation of salary and interest credits during an employee’s work life, or (iii) the
individual account balance from the Company’s prior defined contribution plan (Transitional Retirement Account or
TRA).
Pension Benefits Retiree Health
(in millions) 2006 2005 2004 2006 2005 2004
Components of Net Periodic Benefit Cost
Defined benefit plans
Service cost ................................................ $244 $234 $222 $ 19 $ 20 $ 22
Interest cost(1) .............................................. 732 581 660 92 90 89
Expected return on plan assets(2) ................................ (802) (622) (678) — — —
Recognized net actuarial loss .................................. 104 98 104 19 31 24
Amortization of prior service credit ............................. (18) (3) (1) (13) (24) (24)
Recognized net transition obligation (asset) ....................... 2 1 (1) — — —
Recognized curtailment/settlement loss .......................... 93 54 44 — — —
Net periodic benefit cost ...................................... 355 343 350 117 117 111
Special termination benefits ................................... — — 2 — — —
Defined contribution plans .................................... 70 71 69 — — —
Total ..................................................... $ 425 $ 414 $ 421 $117 $117 $111
(1) Interest cost includes interest expense on non-TRA obligations of $340, $328, and $312 and interest expense
directly allocated to TRA participant accounts of $392, $253, and $348 for the years ended December 31, 2006,
2005 and 2004, respectively.
(2) Expected return on plan assets includes expected investment income on non-TRA assets of $410, $369, and $330
and actual investment income on TRA assets of $392, $253, and $348 for the years ended December 31, 2006,
2005 and 2004, respectively.
86