Xerox 2006 Annual Report Download - page 38
Download and view the complete annual report
Please find page 38 of the 2006 Xerox annual report below. You can navigate through the pages in the report by either clicking on the pages listed below, or by using the keyword search tool below to find specific information within the annual report.-
 1
1 -
2
-
3
-
4
-
5
-
6
-
7
-
8
-
9
-
10
-
11
-
12
-
13
-
14
-
15
-
16
-
17
-
18
-
19
-
20
-
21
-
22
-
23
-
24
-
25
-
26
-
27
-
 28
28 -
 29
29 -
 30
30 -
 31
31 -
 32
32 -
 33
33 -
 34
34 -
 35
35 -
 36
36 -
 37
37 -
 38
38 -
 39
39 -
 40
40 -
 41
41 -
 42
42 -
 43
43 -
 44
44 -
 45
45 -
 46
46 -
 47
47 -
 48
48 -
49
-
50
-
51
-
52
-
53
-
54
-
55
-
56
-
57
-
58
-
59
-
60
-
61
-
62
-
63
-
64
-
65
-
66
-
67
-
68
-
69
-
70
-
71
-
72
-
73
-
74
-
75
-
76
-
77
-
78
-
79
-
80
-
81
-
82
-
83
-
84
-
85
-
86
-
87
-
88
-
89
-
90
-
91
-
92
-
93
-
94
-
95
-
96
-
97
-
98
-
99
-
100
-
101
-
102
-
103
-
104
-
105
-
106
-
107
-
108
-
109
-
110
-
111
-
112
-
113
-
114
-
115
-
116
 |
 |

Growth in post sale and other revenue will be driven by
our success at increasing the amount of our equipment at
customer locations, the volume of pages and mix of color
pages generated on that equipment, as well as growth in
document management services.
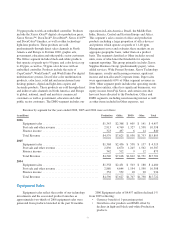
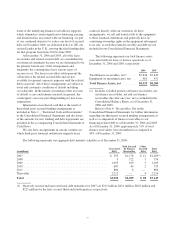
Segment Operating Profit
Segment Operating profit and operating margin for the three years ended December 31, 2006 were as follows:
(in millions) Production Office DMO Other Total
2006
Operating Profit ..................................... $403 $832 $124 $ 31 $1,390
Operating Margin .................................... 8.8% 10.9% 6.4% 1.8% 8.7%
2005
Operating Profit ..................................... $427 $819 $ 64 $151 $1,461
Operating Margin .................................... 9.4% 10.8% 3.5% 8.7% 9.3%
2004
Operating Profit ..................................... $511 $779 $ 35 $(125) $1,200
Operating Margin .................................... 11.1% 10.2% 2.1% (7.0)% 7.6%
Production: 2006 Operating profit declined $24
million from 2005, reflecting reduced gross margins
impacted by product mix, price declines and higher bad
debt expense, partially offset by both lower R,D&E
spending and selling expenses. The reduction in R,D&E
reflects benefits from our platform strategy to launch new
technology and lower spending related to environmental
compliance activities.
2005 Operating profit declined $84 million from
2004, primarily reflecting reduced gross margins
impacted by mix, and higher selling expenses, which
were partially offset by improvements in G&A and
R,D&E efficiencies.
Office: 2006 Operating profit increased $13 million
from 2005, reflecting reduction in SAG expenses partially
offset by lower gross profit. 2005 Operating profit
increased $40 million primarily reflecting lower SAG,
partially offset by lower gross margins impacted by mix
and higher R,D&E.
DMO: 2006 Operating profit increased $60 million
from 2005, reflecting higher gross profit and reduction in
SAG expenses, including improvement in bad debt
expenses. 2005 Operating profit increased $29 million
from 2004, primarily reflecting increasing revenues and
operating margin contributions from Eurasia and Central
and Eastern Europe.
Other: 2006 Operating profit declined $120 million
from 2005, principally due to:
• Absence of the 2005 $93 million gain related to the
sale of Integic and the 2005 $57 million interest
income benefit from the finalization of the 1996-
1998 Internal Revenue Service tax audit.
• $13 million pre-tax write-off of the remaining
unamortized deferred debt issuance costs associated
with the termination of our 2003 Credit Facility that
occurred in 2006.
• Lower 2006 interest income of $12 million and
increased non-financing interest expense of $8
million.
The above were partially offset by the following:
• Increased paper profit due to increased sales as well
as reduced SAG expenses primarily from
organizational streamlining.
• $44 million in gains on sale of assets.
2005 Operating profit increased $276 million as
compared to 2004, principally due to:
• Reduced interest expense of $157 million, primarily
due to lower average debt balances.
• Higher interest income of $63, which includes $57
million associated with the finalization of the 1996-
1998 IRS audit.
• An improvement in aggregate currency gains and
losses of $68 million.
• A gain on the sale of Integic of $93 million.
• These items were partially offset by the absence of
the $38 million pension settlement gain from Fuji
Xerox in 2004, as well as the absence of the $38
million gain from the 2004 sale of our ownership
interest in ScanSoft.
Refer to Note 2 – Segment Reporting in the
Consolidated Financial Statements, for further discussion
on our reportable segment operating revenue and
operating profit.
36