Xerox 2006 Annual Report Download - page 113
Download and view the complete annual report
Please find page 113 of the 2006 Xerox annual report below. You can navigate through the pages in the report by either clicking on the pages listed below, or by using the keyword search tool below to find specific information within the annual report.-
 1
1 -
2
-
3
-
4
-
5
-
6
-
7
-
8
-
9
-
10
-
11
-
12
-
13
-
14
-
15
-
16
-
17
-
18
-
19
-
20
-
21
-
22
-
23
-
24
-
25
-
26
-
27
-
28
-
29
-
30
-
31
-
32
-
33
-
34
-
35
-
36
-
37
-
38
-
39
-
40
-
41
-
42
-
43
-
44
-
45
-
46
-
47
-
48
-
49
-
50
-
51
-
52
-
53
-
54
-
55
-
56
-
57
-
58
-
59
-
60
-
61
-
62
-
63
-
64
-
65
-
66
-
67
-
68
-
69
-
70
-
71
-
72
-
73
-
74
-
75
-
76
-
77
-
78
-
79
-
80
-
81
-
82
-
83
-
84
-
85
-
86
-
87
-
88
-
89
-
90
-
91
-
92
-
93
-
94
-
95
-
96
-
97
-
98
-
99
-
100
-
101
-
102
-
 103
103 -
 104
104 -
 105
105 -
 106
106 -
 107
107 -
 108
108 -
 109
109 -
 110
110 -
 111
111 -
 112
112 -
 113
113 -
 114
114 -
 115
115 -
 116
116
 |
 |

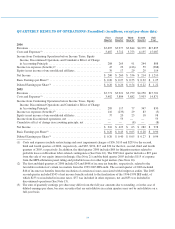
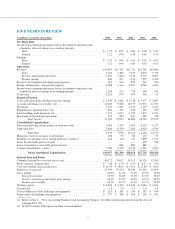
FIVE YEARS IN REVIEW
(in millions, except per-share data) 2006 2005 2004 2003 2002
Per-Share Data
Income from continuing operations before discontinued operations and
cumulative effect of change in accounting principle
Basic ...................................................... $ 1.25 $ 0.91 $ 0.84 $ 0.38 $ 0.11
Diluted ..................................................... 1.22 0.90 0.78 0.36 0.10
Earnings
Basic ...................................................... $ 1.25 $ 0.96 $ 0.94 $ 0.38 $ 0.02
Diluted ..................................................... 1.22 0.94 0.86 0.36 0.02
Operations
Revenues ....................................................... $15,895 $15,701 $15,722 $15,701 $15,849
Sales ...................................................... 7,464 7,400 7,259 6,970 6,752
Service, outsourcing and rentals ................................. 7,591 7,426 7,529 7,734 8,097
Finance income .............................................. 840 875 934 997 1,000
Research, development and engineering expenses ....................... 922 943 914 962 980
Selling, administrative and general expenses ........................... 4,008 4,110 4,203 4,249 4,437
Income from continuing operations before discontinued operations and
cumulative effect of change in accounting principle ................... 1,210 933 776 360 154
Net income ..................................................... 1,210 978 859 360 91
Financial Position
Cash, cash equivalents and Short-term investments ...................... $ 1,536 $ 1,566 $ 3,218 $ 2,477 $ 2,887
Accounts and finance receivables, net ................................ 10,043 9,886 10,573 10,972 11,077
Inventories ...................................................... 1,163 1,201 1,143 1,152 1,231
Equipment on operating leases, net ................................... 481 431 398 364 450
Land, buildings and equipment, net .................................. 1,527 1,627 1,759 1,827 1,757
Investment in discontinued operations ................................ 295 420 440 449 728
Total Assets(1) ........................................... 21,709 21,953 24,884 24,591 25,550
Consolidated Capitalization
Short-term debt and current portion of long-term debt .................... 1,485 1,139 3,074 4,236 4,377
Long-term debt .................................................. 5,660 6,139 7,050 6,930 9,794
Total Debt .............................................. 7,145 7,278 10,124 11,166 14,171
Minorities’ interests in equity of subsidiaries ........................... 108 90 80 102 73
Liabilities to subsidiary trusts issuing preferred securities(2) ............... 624 724 717 1,809 1,793
Series B convertible preferred stock .................................. — — — 499 508
Series C mandatory convertible preferred stock ......................... — 889 889 889 —
Common shareholders’ equity(1) ..................................... 7,080 6,319 6,244 3,291 1,893
Total Consolidated Capitalization .......................... $14,957 $15,300 $18,054 $17,756 $18,438
Selected Data and Ratios
Common shareholders of record at year-end ........................... 40,372 53,017 55,152 56,326 57,300
Book value per common share ...................................... $ 7.48 $ 6.79 $ 6.53 $ 4.15 $ 2.56
Year-end common stock market price ................................ $ 16.95 $ 14.65 $ 17.01 $ 13.80 $ 8.05
Employees at year-end ............................................ 53,700 55,220 58,100 61,100 67,800
Gross margin .................................................... 40.6% 41.2% 41.6% 42.6% 42.8%
Sales gross margin ........................................... 35.7% 36.6% 37.4% 37.6% 38.2%
Service, outsourcing and rentals gross margin ...................... 43.0% 43.3% 43.0% 44.3% 44.5%
Finance gross margin ......................................... 63.7% 62.7% 63.1% 63.7% 59.9%
Working capital .................................................. $ 4,056 $ 4,390 $ 4,628 $ 2,666 $ 3,242
Current ratio .................................................... 1.9 2.0 1.7 1.4 1.4
Cost of additions to land, buildings and equipment ...................... $ 215 $ 181 $ 204 $ 197 $ 146
Depreciation on buildings and equipment ............................. $ 277 $ 280 $ 305 $ 299 $ 341
(1) Refer to Note 1 – “New Accounting Standards and Accounting Changes” for further information representing the effect of
adopting FAS 158.
(2) In 2005, includes $98 reported in other current liabilities.
111