Xerox 2006 Annual Report Download - page 105
Download and view the complete annual report
Please find page 105 of the 2006 Xerox annual report below. You can navigate through the pages in the report by either clicking on the pages listed below, or by using the keyword search tool below to find specific information within the annual report.-
 1
1 -
2
-
3
-
4
-
5
-
6
-
7
-
8
-
9
-
10
-
11
-
12
-
13
-
14
-
15
-
16
-
17
-
18
-
19
-
20
-
21
-
22
-
23
-
24
-
25
-
26
-
27
-
28
-
29
-
30
-
31
-
32
-
33
-
34
-
35
-
36
-
37
-
38
-
39
-
40
-
41
-
42
-
43
-
44
-
45
-
46
-
47
-
48
-
49
-
50
-
51
-
52
-
53
-
54
-
55
-
56
-
57
-
58
-
59
-
60
-
61
-
62
-
63
-
64
-
65
-
66
-
67
-
68
-
69
-
70
-
71
-
72
-
73
-
74
-
75
-
76
-
77
-
78
-
79
-
80
-
81
-
82
-
83
-
84
-
85
-
86
-
87
-
88
-
89
-
90
-
91
-
92
-
93
-
94
-
 95
95 -
 96
96 -
 97
97 -
 98
98 -
 99
99 -
 100
100 -
 101
101 -
 102
102 -
 103
103 -
 104
104 -
 105
105 -
 106
106 -
 107
107 -
 108
108 -
 109
109 -
 110
110 -
 111
111 -
 112
112 -
 113
113 -
 114
114 -
 115
115 -
116
 |
 |

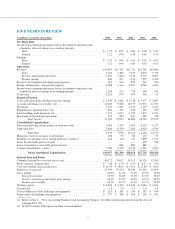
NOTES TO THE CONSOLIDATED FINANCIAL STATEMENTS
(Dollars in millions, except per-share data and unless otherwise indicated)
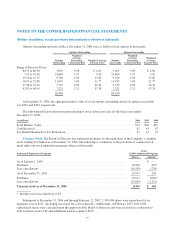
Options outstanding and exercisable at December 31, 2006 were as follows (stock options in thousands):
Options Outstanding Options Exercisable
Number
Outstanding
Weighted
Average
Remaining
Contractual Life
Weighted Average
Exercise Price
Number
Exercisable
Weighted
Average
Remaining
Contractual Life
Weighted
Average
Exercise Price
Range of Exercise Prices
$4.75 to $6.98 3,965 3.98 $ 4.91 3,665 3.89 $ 4.90
7.13 to 10.69 23,864 5.37 9.20 23,864 5.37 9.20
10.70 to 15.27 9,760 4.98 13.66 9,760 4.98 13.66
16.91 to 22.88 11,835 3.00 21.77 11,835 3.00 21.77
25.38 to 32.16 3,735 2.90 26.36 3,735 2.90 26.36
42.83 to 60.95 7,321 2.21 53.78 7,321 2.21 53.78
60,480 60,180
At December 31, 2006, the aggregate intrinsic value of stock options outstanding and stock options exercisable
was $267 and $263, respectively.
The following table provides information relating to stock option exercises for the three years ended
December 31, 2006:
(in millions) 2006 2005 2004
Total Intrinsic Value ............................................................. $72 $36 $67
Cash Received .................................................................. 82 41 67
Tax Benefit Realized for Tax Deductions ............................................. 25 12 23
Treasury Stock: The Board of Directors has authorized programs for the repurchase of the Company’s common
stock totaling $2.0 billion as of December 31, 2006. The following is a summary of the purchases of common stock
made under our stock repurchase programs (shares in thousands):
Authorized Repurchase Programs
Total
$2,000 Authorized Programs
Shares Amount
As of January 1, 2005 ........................................................ — $ —
Purchases .................................................................. 30,502 433*
Less cancellations ........................................................... (16,585) (230)
As of December 31, 2005 ..................................................... 13,917 203
Purchases .................................................................. 70,111 1,069*
Less cancellations ........................................................... (75,665) (1,131)
Treasury stock as of December 31, 2006 ........................................ 8,363 $ 141
* Includes total associated fees of $3.
Subsequent to December 31, 2006 and through February 12, 2007, 7,399,400 shares were repurchased at an
aggregate cost of $127, (including associated fees of less than $1). Additionally, in February 2007, 8,813,000
repurchased shares were cancelled upon the approval of the Board of Directors and were recorded as a reduction to
both Common stock of $9 and Additional paid-in-capital of $139.
103