Xerox 2006 Annual Report Download - page 41
Download and view the complete annual report
Please find page 41 of the 2006 Xerox annual report below. You can navigate through the pages in the report by either clicking on the pages listed below, or by using the keyword search tool below to find specific information within the annual report.-
 1
1 -
2
-
3
-
4
-
5
-
6
-
7
-
8
-
9
-
10
-
11
-
12
-
13
-
14
-
15
-
16
-
17
-
18
-
19
-
20
-
21
-
22
-
23
-
24
-
25
-
26
-
27
-
28
-
29
-
30
-
 31
31 -
 32
32 -
 33
33 -
 34
34 -
 35
35 -
 36
36 -
 37
37 -
 38
38 -
 39
39 -
 40
40 -
 41
41 -
 42
42 -
 43
43 -
 44
44 -
 45
45 -
 46
46 -
 47
47 -
 48
48 -
 49
49 -
 50
50 -
 51
51 -
52
-
53
-
54
-
55
-
56
-
57
-
58
-
59
-
60
-
61
-
62
-
63
-
64
-
65
-
66
-
67
-
68
-
69
-
70
-
71
-
72
-
73
-
74
-
75
-
76
-
77
-
78
-
79
-
80
-
81
-
82
-
83
-
84
-
85
-
86
-
87
-
88
-
89
-
90
-
91
-
92
-
93
-
94
-
95
-
96
-
97
-
98
-
99
-
100
-
101
-
102
-
103
-
104
-
105
-
106
-
107
-
108
-
109
-
110
-
111
-
112
-
113
-
114
-
115
-
116
 |
 |

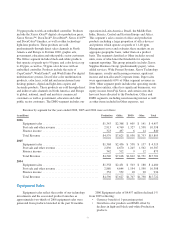
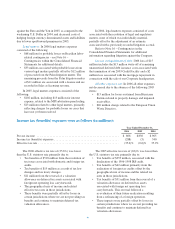
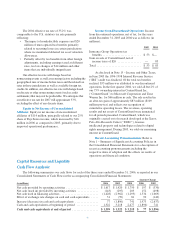
Other Expenses, Net: Other expenses, net for the three years ended December 31, 2006 consisted of the
following:
Year Ended December 31,
(in millions) 2006 2005 2004
Non-financing interest expense ........................................ $239 $ 231 $363
Interest income ..................................................... (69) (138) (75)
Gain on sales of businesses and assets ................................... (44) (97) (61)
Currency losses, net ................................................. 39 5 73
Amortization of intangible assets ....................................... 41 38 37
Legal matters ....................................................... 89 115 9
Minorities’ interests in earnings of subsidiaries ............................ 22 15 8
Loss on extinguishment of debt ........................................ 15 — —
All other expenses, net ............................................... 4 55 15
Total Other expenses, net ............................................. $336 $ 224 $369
Non-financing interest expense: In 2006
non-financing interest expense increased due to higher
interest rates partially offset by lower average debt
balances. 2005 non-financing interest expense decreased
due to lower average debt balances as a result of
scheduled term debt repayments and medium-term note
redemptions, as well as the full-year effect of the
December 2004 Capital Trust II liability conversion.
Interest income: Interest income is derived primarily
from our invested cash and cash equivalent balances and
interest resulting from periodic tax settlements. In 2006,
interest income decreased primarily due to:
• Absence of $57 million of interest income
associated with the 2005 settlement of the 1996-
1998 IRS audit. (Refer to Note 15 – Income and
Other Taxes in the Consolidated Financial
Statements).
• Lower average cash balances partially offset by
higher rates of return.
In 2005, interest income increased primarily due to:
• A $57 million increase associated with the
previously disclosed settlement of the 1996-1998
IRS audit.
• A $23 million increase primarily reflecting higher
rates of return from our money market funds.
• Partially offset by the absence of $26 million of
interest income related to a 2004 domestic tax
refund.
Gain on sales of businesses and assets: 2006 gain on
sales of businesses and assets primarily consisted of the
following:
• $15 million on the sale of our Corporate
headquarters. (Refer to Note 6 – Land, buildings
and equipment, net in the Consolidated Financial
Statements for further information.)
• $11 million on the sale of a manufacturing facility.
• $10 million receipt from escrow of additional
proceeds related to our first quarter 2005 sale of
Integic. The proceeds were placed in escrow upon
the sale of Integic pending completion of an
indemnification period, which ended in 2006.
In 2005, gain on sales of businesses and assets
primarily consist of the $93 million gain on the sale of
Integic. In 2004, gains on the sale of businesses and assets
primarily reflect the $38 million pre-tax gain from the
sale of our ownership interest in ScanSoft, as well as,
gains totaling $14 million related to the sale of certain
excess land and buildings in Europe and Mexico.
Currency gains and losses: Currency gains and
losses primarily result from the re-measurement of
foreign currency-denominated assets and liabilities, the
cost of hedging foreign currency-denominated assets and
liabilities, the mark-to-market of any foreign exchange
contracts utilized to hedge those foreign currency-
denominated assets and liabilities and the mark-to-market
impact of hedges of anticipated transactions, primarily
future inventory purchases, for which we do not generally
apply cash flow hedge accounting treatment.
In 2006, 2005 and 2004 currency losses totaled $39
million, $5 million and $73 million respectively. The 2006
increase in currency losses primarily reflected the
mark-to-market of derivative contracts which are
economically hedging anticipated foreign currency
denominated payments. The mark-to-market losses were
primarily due to the strengthening of the Euro against other
currencies, in particular the Canadian Dollar, U.S. Dollar
and Japanese Yen, as compared to the weakening Euro in
2005. The decrease in 2005 from 2004 was primarily due
to the strengthening of the U.S. and Canadian Dollars
39