Xerox 2006 Annual Report Download - page 39
Download and view the complete annual report
Please find page 39 of the 2006 Xerox annual report below. You can navigate through the pages in the report by either clicking on the pages listed below, or by using the keyword search tool below to find specific information within the annual report.-
 1
1 -
2
-
3
-
4
-
5
-
6
-
7
-
8
-
9
-
10
-
11
-
12
-
13
-
14
-
15
-
16
-
17
-
18
-
19
-
20
-
21
-
22
-
23
-
24
-
25
-
26
-
27
-
28
-
 29
29 -
 30
30 -
 31
31 -
 32
32 -
 33
33 -
 34
34 -
 35
35 -
 36
36 -
 37
37 -
 38
38 -
 39
39 -
 40
40 -
 41
41 -
 42
42 -
 43
43 -
 44
44 -
 45
45 -
 46
46 -
 47
47 -
 48
48 -
 49
49 -
50
-
51
-
52
-
53
-
54
-
55
-
56
-
57
-
58
-
59
-
60
-
61
-
62
-
63
-
64
-
65
-
66
-
67
-
68
-
69
-
70
-
71
-
72
-
73
-
74
-
75
-
76
-
77
-
78
-
79
-
80
-
81
-
82
-
83
-
84
-
85
-
86
-
87
-
88
-
89
-
90
-
91
-
92
-
93
-
94
-
95
-
96
-
97
-
98
-
99
-
100
-
101
-
102
-
103
-
104
-
105
-
106
-
107
-
108
-
109
-
110
-
111
-
112
-
113
-
114
-
115
-
116
 |
 |

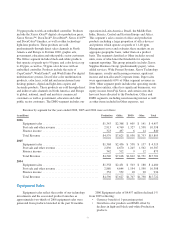
Gross Margins
Gross margins by revenue classification were as
follows:
Year Ended December 31,
(in millions) 2006 2005 2004
Total Gross margin .......... 40.6% 41.2% 41.6%
Sales ................. 35.7% 36.6% 37.4%
Service, outsourcing and
rentals .............. 43.0% 43.3% 43.0%
Finance income ........ 63.7% 62.7% 63.1%
2006 Gross margin of 40.6% decreased by
0.6-percentage points from 2005 due to product mix.
Price declines of 1.4-percentage points were offset by
productivity improvements and other variances of
1.4-percentage points. 2005 Gross margin of 41.2%
decreased 0.4-percentage points from 2004 reflecting a
decline in product mix of 1.3-percentage points reflecting
a higher proportion of sales in office printers and light
production systems. Price declines of 1.5-percentage
points were more than offset by cost improvements of
2.3-percentage points.
2006 Sales gross margin of 35.7% decreased
0.9-percentage points from 2005 as price declines of
2.1-percentage points exceeded the combined impacts of
productivity improvements, product mix and other
variances of 1.2-percentage points. 2005 Sales gross
margin of 36.6% decreased 0.8-percentage points from
2004 driven by product mix declines of 1.5-percentage
points. Price declines of 2.2-percentage points were more
than offset by cost improvements of 2.4-percentage points.
Product mix reflects a higher proportion of sales of
products with lower gross margins, including office
printers and light production systems, and a lower
proportion of sales of products with higher gross margins
such as higher end office black-and-white multifunction
devices and high-end production black-and-white systems.
2006 Service, outsourcing and rentals margin of
43.0% decreased 0.3-percentage points from 2005 as
product mix decline of 1.3-percentage points exceeded
the impact of productivity improvements, price and other
variances of 1.0-percentage points. 2005 Service,
outsourcing and rental margin of 43.3% increased
0.3-percentage points driven by cost improvements of
2.6-percentage points, which more than offset by prices
declines of 1.1-percentage points and product mix
declines of 0.9-percentage points.
2006 Finance income gross margin of 63.7%
improved 1.0-percentage point and 2005 Finance income
gross margin of 62.7% declined 0.4-percentage points due
to changes in interest costs specific to equipment
financing. Equipment financing interest is determined
based on an estimated cost of funds, applied against the
estimated level of debt required to support our net finance
receivables. Prior to 2006, the estimated cost of funds was
primarily based on our secured borrowing rates. As a
result of the reduction in our level of secured borrowings,
effective January 1, 2006 the estimated cost of funds is
based on a blended rate for term and duration comparable
to available borrowing rates for a BBB rated company as
of the end of each period. This change in basis did not
materially impact the calculated amount of Equipment
finance interest expense and accordingly did not impact
comparability between the periods. The estimated level of
debt is based on an assumed 7 to 1 leverage ratio of debt/
equity as compared to our average finance receivable
balance during the applicable period.
Research, development and engineering
(“R,D&E”) of $922 million in 2006 was $21 million
lower than the prior year primarily due to lower
environmental compliance spending. We expect 2007
R,D&E spending to approximate 5-6% of total revenue.
Research and development (“R&D”) of $761 million
in 2006 increased from the prior year by $6 million
reflecting higher expenditures in the Production and
Office segments primarily related to expected 2007
product launches. We invest in technological
development, particularly in color, and believe our R&D
spending is sufficient to remain technologically
competitive. Our R&D is strategically coordinated with
that of Fuji Xerox, which invested $660 million and $720
million in R&D in 2006 and 2005, respectively. 2005
R&D expense of $755 million was $5 million lower than
the prior year, primarily reflecting lower expenditures in
the Production segment, which were partially offset by
increased spending in the Office segment. The lower
spending in the Production segment was as a result of
product launches, and cost efficiencies that we captured
from our platform development strategy.
Sustaining engineering costs of $161 million
decreased by $27 million from the prior year, reflecting
lower spending related to environmental compliance
activities and maturing product platforms. Refer to
Note 1 – “Basis of Presentation” in the Consolidated
Financial Statements for additional information.
37