Xerox 2006 Annual Report Download - page 32
Download and view the complete annual report
Please find page 32 of the 2006 Xerox annual report below. You can navigate through the pages in the report by either clicking on the pages listed below, or by using the keyword search tool below to find specific information within the annual report.-
 1
1 -
2
-
3
-
4
-
5
-
6
-
7
-
8
-
9
-
10
-
11
-
12
-
13
-
14
-
15
-
16
-
17
-
18
-
19
-
20
-
21
-
 22
22 -
 23
23 -
 24
24 -
 25
25 -
 26
26 -
 27
27 -
 28
28 -
 29
29 -
 30
30 -
 31
31 -
 32
32 -
 33
33 -
 34
34 -
 35
35 -
 36
36 -
 37
37 -
 38
38 -
 39
39 -
 40
40 -
 41
41 -
 42
42 -
43
-
44
-
45
-
46
-
47
-
48
-
49
-
50
-
51
-
52
-
53
-
54
-
55
-
56
-
57
-
58
-
59
-
60
-
61
-
62
-
63
-
64
-
65
-
66
-
67
-
68
-
69
-
70
-
71
-
72
-
73
-
74
-
75
-
76
-
77
-
78
-
79
-
80
-
81
-
82
-
83
-
84
-
85
-
86
-
87
-
88
-
89
-
90
-
91
-
92
-
93
-
94
-
95
-
96
-
97
-
98
-
99
-
100
-
101
-
102
-
103
-
104
-
105
-
106
-
107
-
108
-
109
-
110
-
111
-
112
-
113
-
114
-
115
-
116
 |
 |
values included in our lease accounting systems. The
range of cash selling prices must be reasonably consistent
with the lease selling prices, taking into account residual
values that accrue to our benefit, in order for us to
determine that such lease prices are indicative of fair
value. Our pricing interest rates, which are used in
determining customer payments, are developed based
upon a variety of factors including local prevailing rates
in the marketplace and the customer’s credit history,
industry and credit class. Our pricing interest rates are
reassessed quarterly based on changes in local prevailing
rates in the marketplace and are adjusted to the extent
such rates vary by twenty-five basis points or more,
cumulatively, from the last rate in effect. The pricing
interest rates generally equal the implicit rates within the
leases, as corroborated by our comparisons of cash to
lease selling prices.
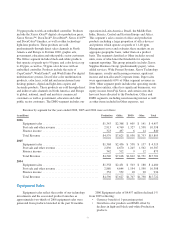
Residual Values for Equipment under Lease:
Residual values represent the recorded estimated fair
value of equipment as of the end of the lease. Residual
values associated with equipment under sales-type leases
are included as a component of our net finance
receivables balance and amounted to $89 million and $87
million at December 31, 2006 and 2005. Residual values
associated with equipment under operating leases
represent the recorded estimated salvage value at the end
of the lease term and are included as a component of
equipment on operating leases, net and amounted to $41
million and $48 million at December 31, 2006 and 2005.
Equipment under operating leases and similar
arrangements are depreciated to estimated salvage value
over their estimated useful lives.
We review residual values regularly and, when
appropriate, adjust them based on estimates of expected
market conditions at the end of the lease, including the
impacts of future product launches, changes in
remanufacturing strategies and the expected lessee
behavior at the end of the lease term. Impairments to
residual values occur when available information
indicates that the decline in recorded value is other than
temporary and we would therefore not be able to fully
recover the recorded values. Impairments on residual
values are recognized as losses in the period in which the
estimate is changed or as a revision in depreciation
estimates for sales-type leases and operating leases,
respectively. We did not record any residual value
impairment charges for the year ended December 31,
2006. We recorded $4 million and $3 million in residual
value impairment charges for the years ended
December 31, 2005 and 2004, respectively.
Accounts and Finance Receivables Allowance for
Doubtful Accounts and Credit Losses: We perform
ongoing credit evaluations of our customers and adjust
credit limits based upon customer payment history and
current creditworthiness. We continuously monitor
collections and payments from our customers and
maintain a provision for estimated credit losses based
upon our historical experience and any specific customer
collection issues that have been identified. While such
credit losses have historically been within our
expectations and the provisions established, we cannot
guarantee that we will continue to experience credit loss
rates similar to those we have experienced in the past.
Measurement of such losses requires consideration of
historical loss experience, including the need to adjust for
current conditions, and judgments about the probable
effects of relevant observable data, including present
economic conditions such as delinquency rates and
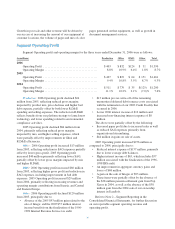
financial health of specific customers. We recorded bad
debt provisions of $87 million, $72 million, and $110
million in SAG expenses in our Consolidated Statements
of Income for the years ended December 31, 2006, 2005
and 2004, respectively. The current level of our provision
for doubtful accounts reflects improvements in customer
administration, receivables aging, write-off trends,
collection practices and credit approval policies.
As discussed above, in preparing our Consolidated
Financial Statements for the three year period ended
December 31, 2006, we estimated our provision for
doubtful accounts based on historical experience and
customer-specific collection issues. This methodology
has been consistently applied for all periods presented.
During the five year period ended December 31, 2006,
our allowance for doubtful accounts ranged from 3.0% to
5.2% of gross receivables. Holding all other assumptions
constant, a 1-percentage point increase or decrease in the
allowance from the December 31, 2006 rate of 3.0%
would change the 2006 provision by approximately $110
million.
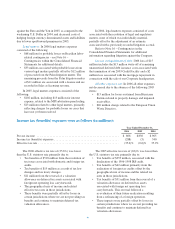
Historically, about half of the provision for doubtful
accounts relates to our finance receivables portfolio. This
provision is inherently more difficult to estimate than the
provision for trade accounts receivable because the
underlying lease portfolio has an average maturity, at any
time, of approximately two to three years and contains
past due billed amounts, as well as unbilled amounts. The
estimated credit quality of any given customer and class
of customer or geographic location can significantly
change during the life of the portfolio. We consider all
available information in our quarterly assessments of the
adequacy of the provision for doubtful accounts.
30