Xerox 2006 Annual Report Download - page 89
Download and view the complete annual report
Please find page 89 of the 2006 Xerox annual report below. You can navigate through the pages in the report by either clicking on the pages listed below, or by using the keyword search tool below to find specific information within the annual report.-
 1
1 -
2
-
3
-
4
-
5
-
6
-
7
-
8
-
9
-
10
-
11
-
12
-
13
-
14
-
15
-
16
-
17
-
18
-
19
-
20
-
21
-
22
-
23
-
24
-
25
-
26
-
27
-
28
-
29
-
30
-
31
-
32
-
33
-
34
-
35
-
36
-
37
-
38
-
39
-
40
-
41
-
42
-
43
-
44
-
45
-
46
-
47
-
48
-
49
-
50
-
51
-
52
-
53
-
54
-
55
-
56
-
57
-
58
-
59
-
60
-
61
-
62
-
63
-
64
-
65
-
66
-
67
-
68
-
69
-
70
-
71
-
72
-
73
-
74
-
75
-
76
-
77
-
78
-
 79
79 -
 80
80 -
 81
81 -
 82
82 -
 83
83 -
 84
84 -
 85
85 -
 86
86 -
 87
87 -
 88
88 -
 89
89 -
 90
90 -
 91
91 -
 92
92 -
 93
93 -
 94
94 -
 95
95 -
 96
96 -
 97
97 -
 98
98 -
 99
99 -
100
-
101
-
102
-
103
-
104
-
105
-
106
-
107
-
108
-
109
-
110
-
111
-
112
-
113
-
114
-
115
-
116
 |
 |

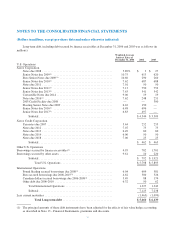
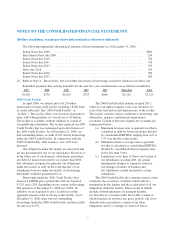
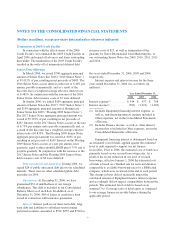
NOTES TO THE CONSOLIDATED FINANCIAL STATEMENTS
(Dollars in millions, except per-share data and unless otherwise indicated)
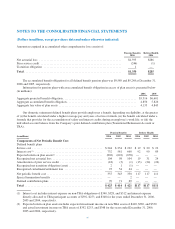
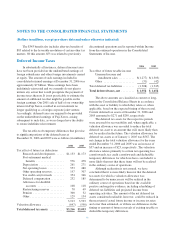
The estimated net loss and prior service credit for
the defined benefit pension plans that will be amortized
from accumulated other comprehensive loss into net
periodic benefit cost over the next fiscal year are $133
and $(21), respectively. The estimated net loss and prior
service credit for the other defined benefit postretirement
plans that will be amortized from accumulated other
comprehensive loss into net periodic benefit cost over the
next fiscal year are $11 and $(12) respectively.
Pension plan assets consist of both defined benefit
plan assets and assets legally restricted to the TRA
accounts. The combined investment results for these
plans, along with the results for our other defined benefit
plans, are shown above in the actual return on plan assets
caption. To the extent that investment results relate to
TRA, such results are charged directly to these accounts
as a component of interest cost.
Plan Amendment
During 2006 we amended one of our domestic
defined benefit pension plans. The amendment changed
the process of calculating benefits for certain employees
who retire from or leave the Company after 2012. The
new process ensures that certain benefit enhancements
are only provided to plan participants who qualify to
receive them based on age and years of service at
termination. The prior process for years after 2012
provided some plan participants with these benefit
enhancements regardless of qualification. The
amendment resulted in a net decrease of $173 in the PBO
and a net decrease of $20 in the ABO. The amendment
also decreased net periodic pension benefit cost by $31
for the full year 2006.
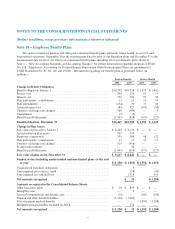
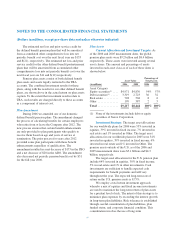
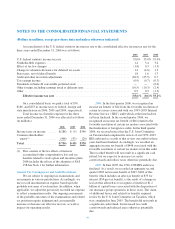
Plan Assets
Current Allocation and Investment Targets: As
of the 2006 and 2005 measurement dates, the global
pension plan assets were $9.2 billion and $8.4 billion,
respectively. These assets were invested among several
asset classes. The amount and percentage of assets
invested in each asset class as of each of these dates is
shown below:
Asset Value
Percentage of
Total Assets
(in millions) 2006 2005 2006 2005
Asset Category
Equity securities(1) .... $4,971 $4,830 54% 57%
Debt securities(1) ..... 3,319 2,723 36 32
Real estate .......... 728 504 8 6
Other .............. 199 387 2 5
Total .............. $9,217 $8,444 100% 100%
(1) None of the investments include debt or equity
securities of Xerox Corporation.
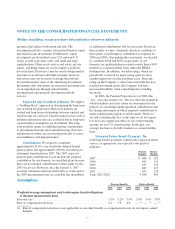
Investment Strategy: The target asset allocations
for our worldwide plans for 2006 were 53% invested in
equities, 39% invested in fixed income, 7% invested in
real estate and 1% invested in Other. The target asset
allocations for our worldwide plans for 2005 were 54%
invested in equities, 39% invested in fixed income, 6%
invested in real estate and 1% invested in Other. The
pension assets outside of the U.S. as of the 2006 and
2005 measurement dates were $5.1 billion and $4.3
billion, respectively.
The target asset allocations for the U.S. pension plan
include 64% invested in equities, 30% in fixed income,
5% in real estate and 1% in other investments. Cash
investments are sufficient to handle expected cash
requirements for benefit payments and will vary
throughout the year. The expected long-term rate of
return on the U.S. pension assets is 8.75%.
We employ a total return investment approach
whereby a mix of equities and fixed income investments
are used to maximize the long-term return of plan assets
for a prudent level of risk. The intent of this strategy is to
minimize plan expenses by exceeding the interest growth
in long-term plan liabilities. Risk tolerance is established
through careful consideration of plan liabilities, plan
funded status, and corporate financial condition. This
consideration involves the use of long-term
87