Xerox 2006 Annual Report Download - page 35
Download and view the complete annual report
Please find page 35 of the 2006 Xerox annual report below. You can navigate through the pages in the report by either clicking on the pages listed below, or by using the keyword search tool below to find specific information within the annual report.-
 1
1 -
2
-
3
-
4
-
5
-
6
-
7
-
8
-
9
-
10
-
11
-
12
-
13
-
14
-
15
-
16
-
17
-
18
-
19
-
20
-
21
-
22
-
23
-
24
-
 25
25 -
 26
26 -
 27
27 -
 28
28 -
 29
29 -
 30
30 -
 31
31 -
 32
32 -
 33
33 -
 34
34 -
 35
35 -
 36
36 -
 37
37 -
 38
38 -
 39
39 -
 40
40 -
 41
41 -
 42
42 -
 43
43 -
 44
44 -
 45
45 -
46
-
47
-
48
-
49
-
50
-
51
-
52
-
53
-
54
-
55
-
56
-
57
-
58
-
59
-
60
-
61
-
62
-
63
-
64
-
65
-
66
-
67
-
68
-
69
-
70
-
71
-
72
-
73
-
74
-
75
-
76
-
77
-
78
-
79
-
80
-
81
-
82
-
83
-
84
-
85
-
86
-
87
-
88
-
89
-
90
-
91
-
92
-
93
-
94
-
95
-
96
-
97
-
98
-
99
-
100
-
101
-
102
-
103
-
104
-
105
-
106
-
107
-
108
-
109
-
110
-
111
-
112
-
113
-
114
-
115
-
116
 |
 |

50 ppm products with an embedded controller. Products
include the Xerox iGen3®digital color production press,
Xerox Nuvera™, DocuTech®, DocuPrint®, Xerox 4110™
and DocuColor®families, as well as older technology
light-lens products. These products are sold
predominantly through direct sales channels in North
America and Europe to Fortune 1000, graphic arts,
government, education and other public sector customers.
The Office segment includes black-and-white products
that operate at speeds up to 90 ppm, and color devices up
to 40 ppm, as well as, 50 ppm color devices with an
embedded controller. Products include the suite of
CopyCentre®, WorkCentre®, and WorkCentre Pro digital
multifunction systems, DocuColor color multifunction
products, color laser, solid ink and monochrome laser
desktop printers, digital and light-lens copiers and
facsimile products. These products are sold through direct
and indirect sales channels in North America and Europe
to global, national, small and mid-size commercial
customers as well as government, education and other
public sector customers. The DMO segment includes our
operations in Latin America, Brazil, the Middle East,
India, Eurasia, Central and Eastern Europe and Africa.
This segment’s sales consist of office and production
products including a large proportion of office devices
and printers which operate at speeds of 11-40 ppm.
Management serves and evaluates these markets on an
aggregate geographic basis, rather than on a product
basis. The segment classified as Other includes several
units, none of which met the thresholds for separate
segment reporting. This group primarily includes Xerox
Supplies Business Group (predominantly paper), value-
added services, Wide Format Systems, Xerox Technology
Enterprises, royalty and licensing revenues, equity net
income and non-allocated Corporate items. Paper sales
were approximately 60% of Other segment revenues in
2006. Other segment profit includes the operating results
from these entities, other less significant businesses, our
equity income from Fuji Xerox, and certain costs that
have not been allocated to the Production, Office and
DMO segments, including non-financing interest as well
as other items included in Other expenses, net.
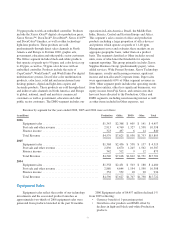
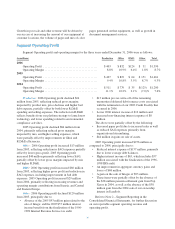
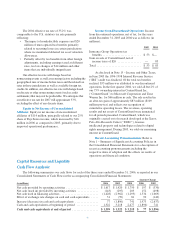
Revenue by segment for the years ended 2006, 2005 and 2004 were as follows:
(in millions) Production Office DMO Other Total
2006
Equipment sales ...................................... $1,343 $2,368 $ 605 $ 141 $ 4,457
Post sale and other revenue ............................. 2,913 4,760 1,327 1,598 10,598
Finance income ...................................... 323 497 6 14 840
Total Revenue ....................................... $4,579 $7,625 $1,938 $1,753 $15,895
2005
Equipment sales ...................................... $1,368 $2,436 $ 558 $ 157 $ 4,519
Post sale and other revenue ............................. 2,830 4,670 1,245 1,562 10,307
Finance income ...................................... 342 512 9 12 875
Total Revenue ....................................... $4,540 $7,618 $1,812 $1,731 $15,701
2004
Equipment sales ...................................... $1,358 $2,431 $ 503 $ 188 $ 4,480
Post sale and other revenue ............................. 2,880 4,644 1,194 1,590 10,308
Finance income ...................................... 352 552 10 20 934
Total Revenue ....................................... $4,590 $7,627 $1,707 $1,798 $15,722
Equipment Sales
Equipment sales reflect the results of our technology
investments and the associated product launches as
approximately two-thirds of 2006 equipment sales were
generated from products launched in the past 24 months.
2006 Equipment sales of $4,457 million declined 1%
from 2005 reflecting:
• Currency benefit of 1-percentage point.
• Growth in color products and DMO offset by
declines in high-end black-and-white Production
products.
33