Xerox 2006 Annual Report Download - page 30
Download and view the complete annual report
Please find page 30 of the 2006 Xerox annual report below. You can navigate through the pages in the report by either clicking on the pages listed below, or by using the keyword search tool below to find specific information within the annual report.-
 1
1 -
2
-
3
-
4
-
5
-
6
-
7
-
8
-
9
-
10
-
11
-
12
-
13
-
14
-
15
-
16
-
17
-
18
-
19
-
 20
20 -
 21
21 -
 22
22 -
 23
23 -
 24
24 -
 25
25 -
 26
26 -
 27
27 -
 28
28 -
 29
29 -
 30
30 -
 31
31 -
 32
32 -
 33
33 -
 34
34 -
 35
35 -
 36
36 -
 37
37 -
 38
38 -
 39
39 -
 40
40 -
41
-
42
-
43
-
44
-
45
-
46
-
47
-
48
-
49
-
50
-
51
-
52
-
53
-
54
-
55
-
56
-
57
-
58
-
59
-
60
-
61
-
62
-
63
-
64
-
65
-
66
-
67
-
68
-
69
-
70
-
71
-
72
-
73
-
74
-
75
-
76
-
77
-
78
-
79
-
80
-
81
-
82
-
83
-
84
-
85
-
86
-
87
-
88
-
89
-
90
-
91
-
92
-
93
-
94
-
95
-
96
-
97
-
98
-
99
-
100
-
101
-
102
-
103
-
104
-
105
-
106
-
107
-
108
-
109
-
110
-
111
-
112
-
113
-
114
-
115
-
116
 |
 |

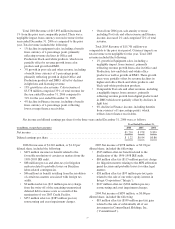
Total 2006 Revenue of $15,895 million increased
1% from the prior year comparable period. There was a
negligible impact from currency on total revenue for the
year ended December 31, 2006 as compared to the prior
year. Total revenue included the following:
• 1% decline in equipment sales, including a benefit
from currency of 1-percentage point, primarily
reflecting revenue declines in Office and
Production black-and-white products, which were
partially offset by revenue growth from color
products and growth in DMO.
• 3% growth in post sale and other revenue, including
a benefit from currency of 1-percentage point,
primarily reflecting growth in digital Office and
Production products and DMO, offset by declines
in light lens and licensing revenue.
• 13% growth in color revenue. Color revenue of
$5,578 million comprised 35% of total revenue for
the year ended December 31, 2006 compared to
31% for the year ended December 31, 2005.
• 4% decline in Finance income, including a benefit
from currency of 1-percentage point, reflecting
lower average finance receivables.
• Overall our 2006 post-sale annuity revenue,
including Post sale and other revenue and Finance
income, increased 2% and comprised 72% of total
revenue.
Total 2005 Revenue of $15,701 million was
comparable to the prior year period. Currency impacts on
total revenue were negligible for the year. Total 2005
revenue included the following:
• 1% growth in Equipment sales, including a
negligible impact from currency, primarily
reflecting revenue growth from color in Office and
Production, low-end black-and-white office
products as well as growth in DMO. These growth
areas were partially offset by revenue declines in
higher-end office black-and-white products, and
black-and-white production products.
• Comparable Post sale and other revenues, including
a negligible impact from currency, primarily
reflecting revenue growth from digital products and
in DMO which were partially offset by declines in
light lens.
• 6% decline in Finance income, including benefits
from currency of 1-percentage points, which
reflects lower finance receivables.
Net income and diluted earnings per share for the three years ended December 31, 2006 were as follows:
(in millions, except share amounts)
Year Ended December 31,
2006 2005 2004
Net income ............................................................. $1,210 $ 978 $ 859
Diluted earnings per share ................................................. $ 1.22 $0.94 $0.86
2006 Net income of $1,210 million, or $1.22 per
diluted share, included the following:
• $472 million income tax benefit related to the
favorable resolution of certain tax matters from the
1999-2003 IRS audit.
• $68 million (pre-tax and after-tax) for litigation
matters related to probable losses on Brazilian
labor-related contingencies.
• $46 million tax benefit resulting from the resolution
of certain tax matters associated with foreign tax
audits.
• $9 million after-tax ($13 million pre-tax) charge
from the write-off of the remaining unamortized
deferred debt issuance costs as a result of the
termination of our 2003 Credit Facility.
• $257 million after-tax ($385 million pre-tax)
restructuring and asset impairment charges.
2005 Net income of $978 million, or $0.94 per
diluted share, included the following:
• $343 million after-tax benefit related to the
finalization of the 1996-1998 IRS audit.
• $84 million after-tax ($115 million pre-tax) charge
for litigation matters relating to the MPI arbitration
panel decision and probable losses for other legal
matters.
• $58 million after-tax ($93 million pre-tax) gain
related to the sale of our entire equity interest in
Integic Corporation (“Integic”).
• $247 million after-tax ($366 million pre-tax)
restructuring and asset impairment charges.
2004 Net income of $859 million, or $0.86 per
diluted share, included the following:
• $83 million after-tax ($109 million pre-tax) gain
related to the sale of substantially all of our
investment in ContentGuard Holdings, Inc.
(“ContentGuard”).
28