Xerox 2006 Annual Report Download - page 29
Download and view the complete annual report
Please find page 29 of the 2006 Xerox annual report below. You can navigate through the pages in the report by either clicking on the pages listed below, or by using the keyword search tool below to find specific information within the annual report.-
 1
1 -
2
-
3
-
4
-
5
-
6
-
7
-
8
-
9
-
10
-
11
-
12
-
13
-
14
-
15
-
16
-
17
-
18
-
 19
19 -
 20
20 -
 21
21 -
 22
22 -
 23
23 -
 24
24 -
 25
25 -
 26
26 -
 27
27 -
 28
28 -
 29
29 -
 30
30 -
 31
31 -
 32
32 -
 33
33 -
 34
34 -
 35
35 -
 36
36 -
 37
37 -
 38
38 -
 39
39 -
40
-
41
-
42
-
43
-
44
-
45
-
46
-
47
-
48
-
49
-
50
-
51
-
52
-
53
-
54
-
55
-
56
-
57
-
58
-
59
-
60
-
61
-
62
-
63
-
64
-
65
-
66
-
67
-
68
-
69
-
70
-
71
-
72
-
73
-
74
-
75
-
76
-
77
-
78
-
79
-
80
-
81
-
82
-
83
-
84
-
85
-
86
-
87
-
88
-
89
-
90
-
91
-
92
-
93
-
94
-
95
-
96
-
97
-
98
-
99
-
100
-
101
-
102
-
103
-
104
-
105
-
106
-
107
-
108
-
109
-
110
-
111
-
112
-
113
-
114
-
115
-
116
 |
 |

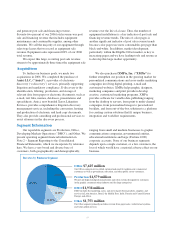
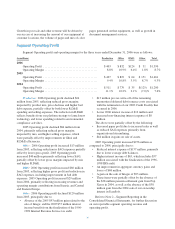
Our 2006 balance sheet strategy focused on
optimizing operating cash flows, maintaining debt levels
primarily to support our customer financing operations,
replacing secured debt collaterized by our finance
receivables with new unsecured debt, and returning
value to shareholders through acquisitions and our
announced share repurchase programs. The successful
implementation of this strategy in 2006 enabled us to
significantly improve our financial position, return to
investment grade and finish the year with a cash, cash
equivalents and short-term investments
balance of $1.5 billion. Our prospective balance
sheet strategy includes: optimizing operating cash flows;
maintaining our investment grade credit ratings;
achieving an optimal cost of capital; rebalancing secured
and unsecured debt; and effectively deploying cash to
deliver and maximize long-term shareholder value. Our
strategy also includes maintaining an appropriate
leverage of our financing assets (finance receivables and
equipment on operating leases) and an appropriate level
of non-financing debt.
Currency Impacts
To understand the trends in the business, we believe
that it is helpful to analyze the impact of changes in the
translation of foreign currencies into U.S. dollars on
revenues and expenses. We refer to this analysis as
“currency impact” or “the impact from currency”.
Revenues and expenses from our Developing Markets
Operations (“DMO”) are analyzed at actual exchange
rates for all periods presented, since these countries
generally have volatile currency and inflationary
environments, and our operations in these countries have
historically implemented pricing actions to recover the
impact of inflation and devaluation. We do not hedge the
translation effect of revenues or expenses denominated in
currencies where the local currency is the functional
currency.
Approximately half of our consolidated revenues are
derived from operations outside of the United States
where the U.S. dollar is not the functional currency.
When compared with the average of the major European
currencies on a revenue-weighted basis, the U.S. dollar
was unchanged in both 2006 and 2005 and 10% weaker in
2004. As a result, the foreign currency translation impact
on revenue was negligible in 2006 and 2005.
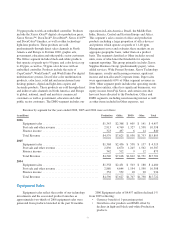
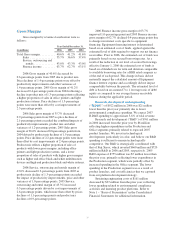
Summary Results:
Revenues for the three years ended December 31, 2006 were as follows:
(in millions)
Year Ended December 31, Percent Change
2006 2005 2004 2006 2005
Equipment sales ............................................ $ 4,457 $ 4,519 $ 4,480 (1)% 1%
Post sale and other revenue ................................... 10,598 10,307 10,308 3% —
Finance income ............................................ 840 875 934 (4)% (6)%
Total Revenue ............................................. $15,895 $15,701 $15,722 1% —
Total Color revenue included in total revenue ..................... $ 5,578 $ 4,928 $ 4,188 13% 18%
The following presentation reconciles the above information to the revenue classifications included in our
Consolidated Statements of Income:
(in millions)
Year Ended December 31,
2006 2005 2004
Sales .................................................................. $ 7,464 $ 7,400 $ 7,259
Less: Supplies, paper and other sales ......................................... (3,007) (2,881) (2,779)
Equipment sales ......................................................... $ 4,457 $ 4,519 $ 4,480
Service, outsourcing and rentals ............................................ $ 7,591 $ 7,426 $ 7,529
Add: Supplies, paper and other sales ......................................... 3,007 2,881 2,779
Post sale and other revenue ................................................ $10,598 $10,307 $10,308
27