Xerox 2006 Annual Report Download - page 43
Download and view the complete annual report
Please find page 43 of the 2006 Xerox annual report below. You can navigate through the pages in the report by either clicking on the pages listed below, or by using the keyword search tool below to find specific information within the annual report.-
 1
1 -
2
-
3
-
4
-
5
-
6
-
7
-
8
-
9
-
10
-
11
-
12
-
13
-
14
-
15
-
16
-
17
-
18
-
19
-
20
-
21
-
22
-
23
-
24
-
25
-
26
-
27
-
28
-
29
-
30
-
31
-
32
-
 33
33 -
 34
34 -
 35
35 -
 36
36 -
 37
37 -
 38
38 -
 39
39 -
 40
40 -
 41
41 -
 42
42 -
 43
43 -
 44
44 -
 45
45 -
 46
46 -
 47
47 -
 48
48 -
 49
49 -
 50
50 -
 51
51 -
 52
52 -
 53
53 -
54
-
55
-
56
-
57
-
58
-
59
-
60
-
61
-
62
-
63
-
64
-
65
-
66
-
67
-
68
-
69
-
70
-
71
-
72
-
73
-
74
-
75
-
76
-
77
-
78
-
79
-
80
-
81
-
82
-
83
-
84
-
85
-
86
-
87
-
88
-
89
-
90
-
91
-
92
-
93
-
94
-
95
-
96
-
97
-
98
-
99
-
100
-
101
-
102
-
103
-
104
-
105
-
106
-
107
-
108
-
109
-
110
-
111
-
112
-
113
-
114
-
115
-
116
 |
 |

The 2004 effective tax rate of 35.2% was
comparable to the U.S. statutory tax rate primarily
reflecting:
• The impact of nondeductible expenses and $20
million of unrecognized tax benefits primarily
related to recurring losses in certain jurisdictions
where we maintained deferred tax asset valuation
allowances.
• Partially offset by tax benefits from other foreign
adjustments, including earnings taxed at different
rates, tax law changes of $14 million and other
items that are individually insignificant.
Our effective tax rate will change based on
nonrecurring events as well as recurring factors including the
geographical mix of income before taxes and the related tax
rates in those jurisdictions as well as available foreign tax
credits. In addition, our effective tax rate will change based
on discrete or other nonrecurring events (such as audit
settlements) that may not be predictable. We anticipate that
our effective tax rate for 2007 will approximate 33%,
excluding the effect of any discrete items.
Equity in Net Income of Unconsolidated
Affiliates: Equity in net income of unconsolidated
affiliates of $114 million, principally related to our 25%
share of Fuji Xerox income, which increased by $16
million in 2006 as compared to 2005, primarily due to
improved operational performance.
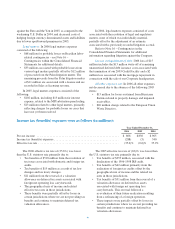
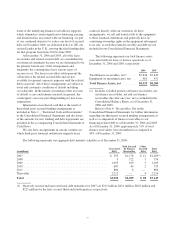
Income from Discontinued Operations: Income
from discontinued operations, net of tax, for the years
ended December 31, 2005 and 2004 was as follows (in
millions):
2005 2004
Insurance Group Operations tax
benefits .......................... $ 53 $—
Gain on sale of ContentGuard, net of
income taxes of $26 ................ — 83
Total .............................. $ 53 $ 83
As disclosed in Note 15 – Income and Other Taxes,
in June 2005 the 1996-1998 Internal Revenue Service
(“IRS”) audit was finalized. Of the total tax benefits
realized, $53 million was attributed to our discontinued
operations. In the first quarter 2004, we sold all but 2% of
our 75% ownership interest in ContentGuard Inc,
(“ContentGuard”) to Microsoft Corporation and Time
Warner Inc. for $66 million in cash. The sale resulted in
an after-tax gain of approximately $83 million ($109
million pre-tax) and reflects our recognition of
cumulative operating losses. The revenues, operating
results and net assets of ContentGuard were immaterial
for all periods presented. ContentGuard, which was
originally created out of research developed at the Xerox
Palo Alto Research Center (“PARC”), licenses
intellectual property and technologies related to digital
rights management. During 2005, we sold our remaining
interest in ContentGuard.
Recent Accounting Pronouncements: Refer to
Note 1 – Summary of Significant Accounting Policies in
the Consolidated Financial Statements for a description of
recent accounting pronouncements including the
respective dates of adoption and the effects on results of
operations and financial condition.
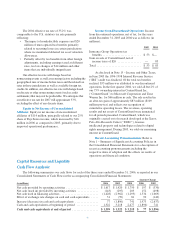
Capital Resources and Liquidity
Cash Flow Analysis:
The following summarizes our cash flows for each of the three years ended December 31, 2006, as reported in our
Consolidated Statements of Cash Flows in the accompanying Consolidated Financial Statements:
Amount Change
(in millions) 2006 2005 2004 2006 2005
Net cash provided by operating activities ...................... $1,617 $ 1,420 $ 1,750 $ 197 $ (330)
Net cash (used in) provided by investing activities .............. (143) (295) 203 152 (498)
Net cash used in financing activities .......................... (1,428) (2,962) (1,293) 1,534 (1,669)
Effect of exchange rate changes on cash and cash equivalents ..... 31 (59) 81 90 (140)
Increase (decrease) in cash and cash equivalents ................ 77 (1,896) 741 1,973 (2,637)
Cash and cash equivalents at beginning of period ............... 1,322 3,218 2,477 (1,896) 741
Cash and cash equivalents at end of period .................. $ 1,399 $ 1,322 $ 3,218 $ 77 $(1,896)
41