Xerox 2006 Annual Report Download - page 40
Download and view the complete annual report
Please find page 40 of the 2006 Xerox annual report below. You can navigate through the pages in the report by either clicking on the pages listed below, or by using the keyword search tool below to find specific information within the annual report.-
 1
1 -
2
-
3
-
4
-
5
-
6
-
7
-
8
-
9
-
10
-
11
-
12
-
13
-
14
-
15
-
16
-
17
-
18
-
19
-
20
-
21
-
22
-
23
-
24
-
25
-
26
-
27
-
28
-
29
-
 30
30 -
 31
31 -
 32
32 -
 33
33 -
 34
34 -
 35
35 -
 36
36 -
 37
37 -
 38
38 -
 39
39 -
 40
40 -
 41
41 -
 42
42 -
 43
43 -
 44
44 -
 45
45 -
 46
46 -
 47
47 -
 48
48 -
 49
49 -
 50
50 -
51
-
52
-
53
-
54
-
55
-
56
-
57
-
58
-
59
-
60
-
61
-
62
-
63
-
64
-
65
-
66
-
67
-
68
-
69
-
70
-
71
-
72
-
73
-
74
-
75
-
76
-
77
-
78
-
79
-
80
-
81
-
82
-
83
-
84
-
85
-
86
-
87
-
88
-
89
-
90
-
91
-
92
-
93
-
94
-
95
-
96
-
97
-
98
-
99
-
100
-
101
-
102
-
103
-
104
-
105
-
106
-
107
-
108
-
109
-
110
-
111
-
112
-
113
-
114
-
115
-
116
 |
 |

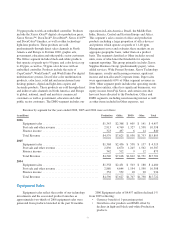
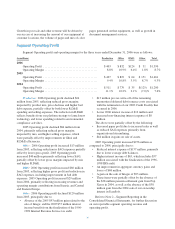
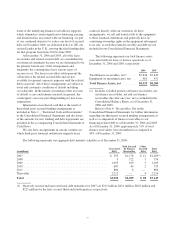
Selling, administrative and general expenses
(“SAG”) SAG expense information was as follows (in
millions):
Year Ended December 31, Amount Change
2006 2005 2004 2006 2005
Total SAG
expenses ..... $4,008 $4,110 $4,203 $(102) $(93)
SAG as a
percentage
of revenue . . . 25.2% 26.2% 26.7% (1.0)% (0.5)%
In 2006, SAG expenses decreased primarily as a
result of the following:
• $58 million reduction in selling expenses compared
to 2005 included lower marketing spending and
headcount reductions.
• $59 million reduction in general and administrative
(“G&A”) expenses as the result of continued
expense management initiatives, including benefits
from restructuring.
• $15 million increase in bad debt expense to $87
million for 2006.
In 2005, SAG expenses decreased primarily as a
result of the following:
• An $86 million reduction in G&A expenses due to
continued expense management initiatives.
• A $38 million decrease in bad debt expense.
• A partially offsetting increase in selling expenses of
$31 million from 2004 due to additional spending
for advertising and marketing programs to support
product launches and other selling expenses, as
well as, special compensation payments related to
the 2005 merit increase process. These increases in
selling expenses were partially offset by the
absence of $28 million Olympic marketing expense
that occurred in 2004.
Bad debt expense included in SAG was $87 million,
$72 million and $110 million in 2006, 2005 and 2004,
respectively. The 2005 reduction in bad debt expense
reflected the benefits associated with recoveries and
adjustments to the reserves, as the result of improvements
in write-offs and aging. This favorable trend in write-offs,
receivables aging and collections continues to be reflected
in our current year bad debt expense. Bad debt expense as
a percent of total revenue was 0.5%, 0.5% and 0.7% for
2006, 2005 and 2004, respectively.
For the three years ended December 31, 2006, 2005
and 2004 we recorded restructuring and asset
impairment charges of $385 million, $366 million and
$86 million, respectively, primarily related to headcount
reductions of approximately 3,400, 3,900 and 1,900
employees, respectively, across all geographies and
segments. 2006 actions associated with these changes
primarily include the following: technical service; service
infrastructure and global back-office optimization;
continued R&D efficiencies and productivity
improvements; supply chain optimization to ensure, for
example, alignment to our global two-tier model
implementation; and selected off-shoring opportunities.
Lease termination and asset impairment charges of $67
million included within these charges primarily relate to
the relocation of certain manufacturing operations as well
as an exit from certain leased and owned facilities. The
remaining restructuring reserve balance as of
December 31, 2006, for all programs was $337 million.
We expect prospective annualized savings associated with
the 2006 actions to be approximately $300 million, with
over half of the savings expected to be in gross margin
and the rest in SAG and R,D&E. Refer to Note 9 –
Restructuring and Asset Impairment Charges in the
Consolidated Financial Statements for further information
regarding our restructuring programs.
Worldwide employment of 53,700 as of
December 31, 2006 declined approximately 1,500 from
December 31, 2005, primarily reflecting reductions
attributable to our restructuring programs and other
attrition partially offset by hiring in strategic business
areas and the hiring of former contract employees in
certain Latin American subsidiaries. Worldwide
employment was approximately 55,200 and 58,100 at
December 31, 2005 and 2004, respectively.
38