Xerox 2006 Annual Report Download - page 68
Download and view the complete annual report
Please find page 68 of the 2006 Xerox annual report below. You can navigate through the pages in the report by either clicking on the pages listed below, or by using the keyword search tool below to find specific information within the annual report.-
 1
1 -
2
-
3
-
4
-
5
-
6
-
7
-
8
-
9
-
10
-
11
-
12
-
13
-
14
-
15
-
16
-
17
-
18
-
19
-
20
-
21
-
22
-
23
-
24
-
25
-
26
-
27
-
28
-
29
-
30
-
31
-
32
-
33
-
34
-
35
-
36
-
37
-
38
-
39
-
40
-
41
-
42
-
43
-
44
-
45
-
46
-
47
-
48
-
49
-
50
-
51
-
52
-
53
-
54
-
55
-
56
-
57
-
 58
58 -
 59
59 -
 60
60 -
 61
61 -
 62
62 -
 63
63 -
 64
64 -
 65
65 -
 66
66 -
 67
67 -
 68
68 -
 69
69 -
 70
70 -
 71
71 -
 72
72 -
 73
73 -
 74
74 -
 75
75 -
 76
76 -
 77
77 -
 78
78 -
79
-
80
-
81
-
82
-
83
-
84
-
85
-
86
-
87
-
88
-
89
-
90
-
91
-
92
-
93
-
94
-
95
-
96
-
97
-
98
-
99
-
100
-
101
-
102
-
103
-
104
-
105
-
106
-
107
-
108
-
109
-
110
-
111
-
112
-
113
-
114
-
115
-
116
 |
 |

NOTES TO THE CONSOLIDATED FINANCIAL STATEMENTS
(Dollars in millions, except per-share data and unless otherwise indicated)
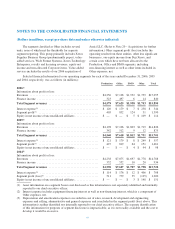
The following table summarizes the maturities and fair market values of our Short-term investments as of
December 31, 2006 and 2005, respectively (in millions):
2006
Due In
1 Year or Less
Due After
1 Year Through
5 Years
Due After
5 Years Through
10 Years
Due After
10 Years Total
Description of Securities
Corporate bonds ............................. $ 65 $— $— $— $ 65
Auction rate municipal bonds .................. — — — 31 31
US government agency securities ............... 23 — — — 23
Certificates of deposit ........................ 8 — — — 8
Total Debt Securities ......................... $ 96 $— $— $ 31 $127
Auction rate preferred securities ................ 10
Total Short-term investments ................. $137
2005
Due In
1 Year or Less
Due After
1 Year Through
5 Years
Due After
5 Years Through
10 Years
Due After
10 Years Total
Description of Securities
Corporate bonds ............................. $ 93 $ 51 $— $— $144
Auction rate municipal bonds .................. — — — 45 45
US government agency securities ............... 13 19 — — 32
Total Debt Securities ......................... $106 $ 70 $— $ 45 $221
Auction rate preferred securities ................ 23
Total Short-term investments ................. $244
Actual maturities may differ from contractual
maturities because borrowers may have the right to
prepay and creditors may have the right to call
obligations. These securities are classified within current
assets because they are highly liquid, traded in active
markets and are available for use, if needed, for current
operations.
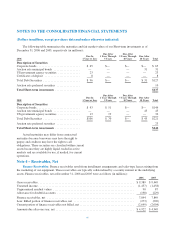
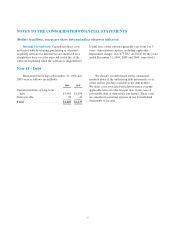
Note 4 – Receivables, Net
Finance Receivables: Finance receivables result from installment arrangements and sales-type leases arising from
the marketing of our equipment. These receivables are typically collateralized by a security interest in the underlying
assets. Finance receivables, net at December 31, 2006 and 2005 were as follows (in millions):
2006 2005
Gross receivables ................................................................. $9,389 $ 9,449
Unearned income ................................................................. (1,437) (1,458)
Unguaranteed residual values ....................................................... 90 87
Allowance for doubtful accounts .................................................... (198) (229)
Finance receivables, net ........................................................... 7,844 7,849
Less: Billed portion of finance receivables, net ......................................... (273) (296)
Current portion of finance receivables not billed, net ..................................... (2,649) (2,604)
Amounts due after one year, net ..................................................... $4,922 $ 4,949
66