Vodafone 2008 Annual Report Download - page 99
Download and view the complete annual report
Please find page 99 of the 2008 Vodafone annual report below. You can navigate through the pages in the report by either clicking on the pages listed below, or by using the keyword search tool below to find specific information within the annual report.-
 1
1 -
2
-
3
-
4
-
5
-
6
-
7
-
8
-
9
-
10
-
11
-
12
-
13
-
14
-
15
-
16
-
17
-
18
-
19
-
20
-
21
-
22
-
23
-
24
-
25
-
26
-
27
-
28
-
29
-
30
-
31
-
32
-
33
-
34
-
35
-
36
-
37
-
38
-
39
-
40
-
41
-
42
-
43
-
44
-
45
-
46
-
47
-
48
-
49
-
50
-
51
-
52
-
53
-
54
-
55
-
56
-
57
-
58
-
59
-
60
-
61
-
62
-
63
-
64
-
65
-
66
-
67
-
68
-
69
-
70
-
71
-
72
-
73
-
74
-
75
-
76
-
77
-
78
-
79
-
80
-
81
-
82
-
83
-
84
-
85
-
86
-
87
-
88
-
 89
89 -
 90
90 -
 91
91 -
 92
92 -
 93
93 -
 94
94 -
 95
95 -
 96
96 -
 97
97 -
 98
98 -
 99
99 -
 100
100 -
 101
101 -
 102
102 -
 103
103 -
 104
104 -
 105
105 -
 106
106 -
 107
107 -
 108
108 -
 109
109 -
110
-
111
-
112
-
113
-
114
-
115
-
116
-
117
-
118
-
119
-
120
-
121
-
122
-
123
-
124
-
125
-
126
-
127
-
128
-
129
-
130
-
131
-
132
-
133
-
134
-
135
-
136
-
137
-
138
-
139
-
140
-
141
-
142
-
143
-
144
-
145
-
146
-
147
-
148
-
149
-
150
-
151
-
152
-
153
-
154
-
155
-
156
-
157
-
158
-
159
-
160
 |
 |

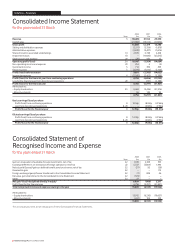
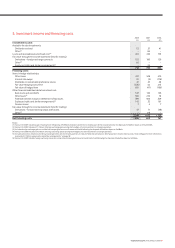
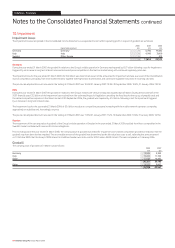
A reconciliation of adjusted operating profit to operating profit/(loss) is shown below. For a reconciliation of operating profit/(loss) to profit/(loss) before taxation,
see the Consolidated Income Statement on page 88.
2008 2007 2006
£m £m £m
Adjusted operating profit 10,075 9,531 9,399
Impairment losses – (11,600) (23,515)
Other items (28) 505 32
Operating profit/(loss) 10,047 (1,564) (14,084)
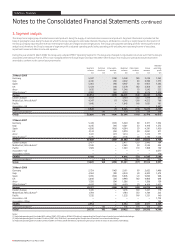
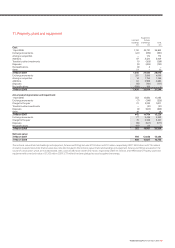
Other
Capitalised expenditure Depreciation
Non-current fixed asset on intangible and Impairment
assets
(1) additions(2) assets amortisation of goodwill
£m £m £m £m £m
31 March 2008
Germany 18,267 392 14 1,067 –
Italy 16,215 411 1 582 –
Spain 14,589 533 – 500 –
UK 7,930 465 – 973 –
Arcor 862 221 – 100 –
Other Europe 8,303 469 11 616 –
Europe 66,166 2,491 26 3,838 –
Eastern Europe 6,879 633 – 665 –
Middle East, Africa & Asia 11,958 1,554 7 954 –
Pacific 1,346 212 – 245 –
EMAPA 20,183 2,399 7 1,864 –
Common functions 717 185 8 207 –
Group 87,066 5,075 41 5,909 –
31 March 2007
Germany 16,233 425 – 1,063 6,700
Italy 13,722 421 26 556 4,900
Spain 12,289 547 – 449 –
UK 8,483 661 – 930 –
Arcor 627 189 – 144 –
Other Europe
7,187 489 6 586 –
Europe 58,541 2,732 32 3,728 11,600
Eastern Europe 6,235 435 – 349 –
Middle East, Africa & Asia 3,079 574 276 272 –
Pacific 1,249 251 – 194 –
EMAPA 10,563 1,260 276 815 –
Common functions 612 216 – 568 –
Group 69,716 4,208 308 5,111 11,600
31 March 2006
Germany 592 – 1,167 19,400
Italy 541 1 588 3,600
Spain 502 – 395 –
UK 665 11 924 –
Arcor 129 – 140 –
Other Europe 511 4 645 515
Europe 2,940 16 3,859 23,515
Eastern Europe 280 – 231 –
Middle East, Africa & Asia 426 – 216 –
Pacific 247 – 209 –
EMAPA 953 – 656 –
Common functions 112 – 189 –
Group 4,005 16 4,704 23,515
Notes:
(1) Includes goodwill, other intangible assets and property, plant and equipment.
(2) Includes additions to property, plant and equipment and computer software, reported within intangible assets.
Vodafone Group Plc Annual Report 2008 97