Vodafone 2008 Annual Report Download - page 108
Download and view the complete annual report
Please find page 108 of the 2008 Vodafone annual report below. You can navigate through the pages in the report by either clicking on the pages listed below, or by using the keyword search tool below to find specific information within the annual report.-
 1
1 -
2
-
3
-
4
-
5
-
6
-
7
-
8
-
9
-
10
-
11
-
12
-
13
-
14
-
15
-
16
-
17
-
18
-
19
-
20
-
21
-
22
-
23
-
24
-
25
-
26
-
27
-
28
-
29
-
30
-
31
-
32
-
33
-
34
-
35
-
36
-
37
-
38
-
39
-
40
-
41
-
42
-
43
-
44
-
45
-
46
-
47
-
48
-
49
-
50
-
51
-
52
-
53
-
54
-
55
-
56
-
57
-
58
-
59
-
60
-
61
-
62
-
63
-
64
-
65
-
66
-
67
-
68
-
69
-
70
-
71
-
72
-
73
-
74
-
75
-
76
-
77
-
78
-
79
-
80
-
81
-
82
-
83
-
84
-
85
-
86
-
87
-
88
-
89
-
90
-
91
-
92
-
93
-
94
-
95
-
96
-
97
-
 98
98 -
 99
99 -
 100
100 -
 101
101 -
 102
102 -
 103
103 -
 104
104 -
 105
105 -
 106
106 -
 107
107 -
 108
108 -
 109
109 -
 110
110 -
 111
111 -
 112
112 -
 113
113 -
 114
114 -
 115
115 -
 116
116 -
 117
117 -
 118
118 -
119
-
120
-
121
-
122
-
123
-
124
-
125
-
126
-
127
-
128
-
129
-
130
-
131
-
132
-
133
-
134
-
135
-
136
-
137
-
138
-
139
-
140
-
141
-
142
-
143
-
144
-
145
-
146
-
147
-
148
-
149
-
150
-
151
-
152
-
153
-
154
-
155
-
156
-
157
-
158
-
159
-
160
 |
 |

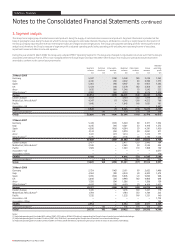
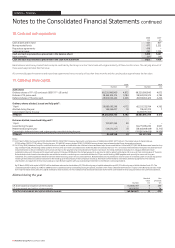
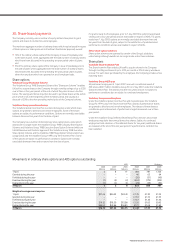
10. Impairment continued
Sensitivity to changes in assumptions
Other than as disclosed below, management believes that no reasonably possible change in any of the above key assumptions would cause the carrying value of any
cash generating unit to exceed its recoverable amount.
31 March 2008
As of 31 January 2008, the date of the Group’s annual impairment test, the estimated recoverable amount of the Group’s operations in Germany and Italy exceeded
their carrying value by £2,700 million and £3,400 million respectively. The table below shows the key assumptions used in the value in use calculation and the amount
by which each key assumption must change in isolation in order for the estimated recoverable amount to be equal to its carrying value in both cases.
Assumptions used in value in Change required for carrying value
use calculation to equal the recoverable amount
Germany Italy Germany Italy
% % Percentage points Percentage points
Pre-tax adjusted discount rate 10.2 11.5 1.6 2.7
Long term growth rate 1.2 0.1 (1.7) (3.0)
Budgeted EBITDA(1)
(2.2) 1.4 (2.0) (4.2)
Budgeted capital expenditure(2) 7.5 to 8.7 5.8 to 9.5 4.2 6.6
Notes:
(1) Budgeted EBITDA is expressed as the compound annual growth rates in the initial five years of the Group’s approved management plans.
(2) Budgeted capital expenditure is expressed as the range of capital expenditure as a percentage of revenue in the initial five years of the Group’s approved management plans.
31 March 2007
Germany
The estimated recoverable amount of the Group’s operations in Germany equalled its carrying value and, consequently, any adverse change in a key assumption could
have caused a further impairment loss to be recognised.
The last value in use calculation during the year ended 31 March 2007 was based on the following assumptions:
Pre-tax risk adjusted discount rate of 10.6%;
Long term growth rate of 1.2%;
Budgeted EBITDA, expressed as the compound annual growth rates in the initial five years of the Group’s approved management plans, of (4.2)%; and
Budgeted capital expenditure, expressed as the range of capital expenditure as a percentage of revenue in the initial five years of the Group’s approved management
plans, of 7.5-7.0%.
Italy
The estimated recoverable amount of the Group’s operations in Italy equalled its carrying value and, consequently, any adverse change in a key assumption could have
caused a further impairment loss to be recognised.
The last value in use calculation during the year ended 31 March 2007 was based on the following assumptions:
Pre-tax risk adjusted discount rate of 11.5%;
Long term growth rate of 1.0%;
Budgeted EBITDA, expressed as the compound annual growth rates in the initial five years of the Group’s approved management plans, of (3.8)%; and
Budgeted capital expenditure, expressed as the range of capital expenditure as a percentage of revenue in the initial five years of the Group’s approved management
plans, of 11.4-8.7%.
•
•
•
•
•
•
•
•
106 Vodafone Group Plc Annual Report 2008
Notes to the Consolidated Financial Statements continued
Vodafone – Financials