Vodafone 2008 Annual Report Download - page 153
Download and view the complete annual report
Please find page 153 of the 2008 Vodafone annual report below. You can navigate through the pages in the report by either clicking on the pages listed below, or by using the keyword search tool below to find specific information within the annual report.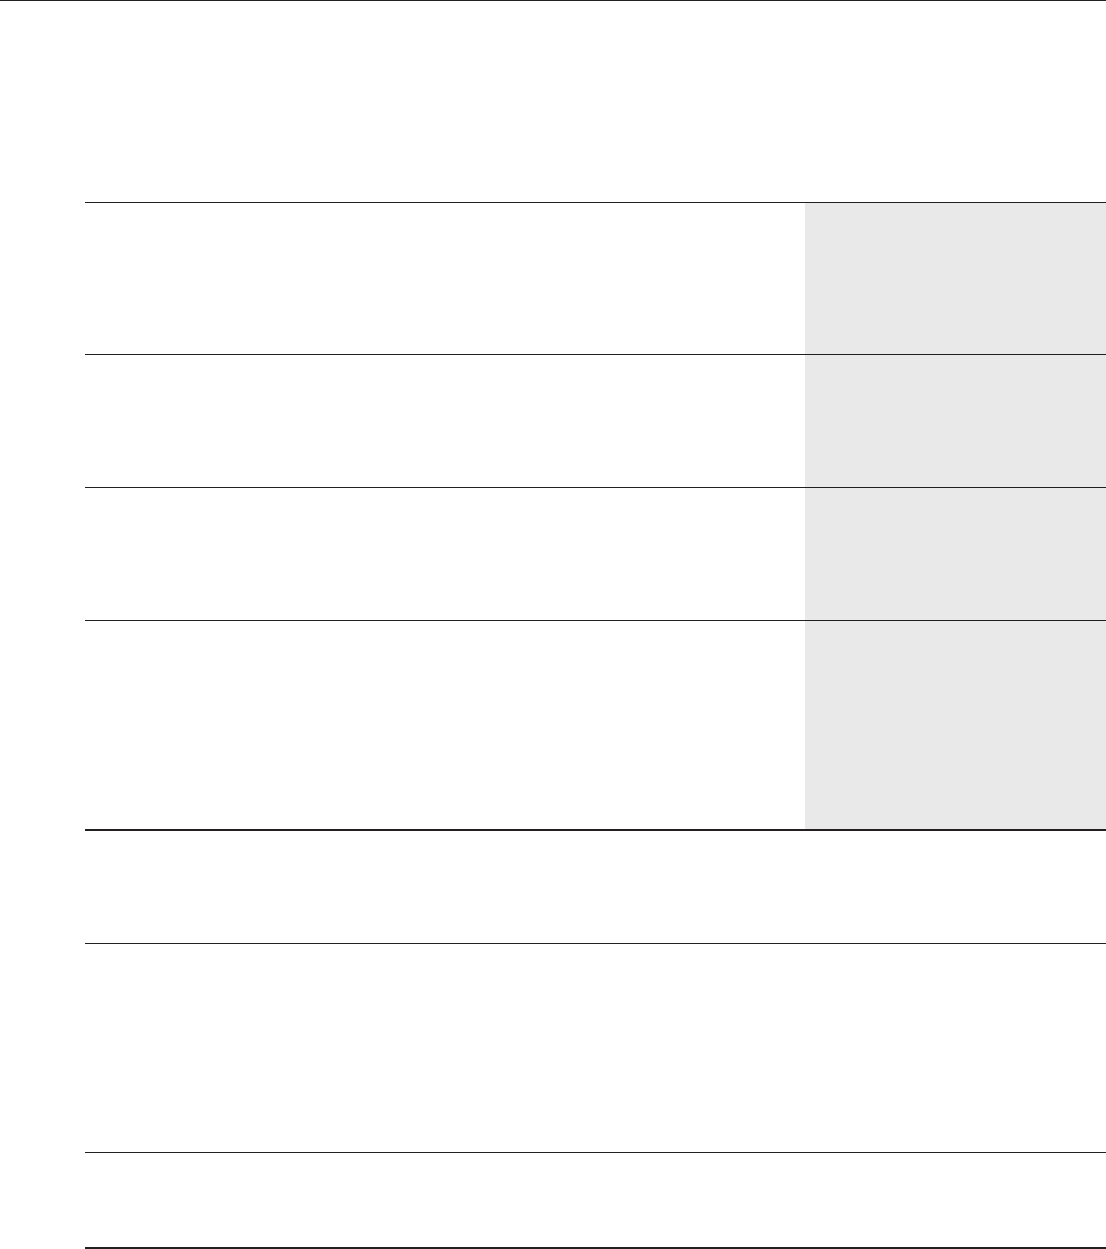
Impact Impact of
of foreign acquisitions
Organic exchange and disposals Reported
growth Percentage Percentage growth
% points points %
31 March 2008
Europe
Interconnect costs 4.1 3.2 1.2 8.5
Other direct costs 1.3 3.9 2.6 7.8
Acquisition costs 6.0 3.2 1.1 10.3
Retention costs 10.1 3.5 0.2 13.8
Operating expenses 0.1 3.3 1.3 4.7
Depreciation and amortisation 0.2 2.9 0.3 3.4
Italy
Total costs (1.0) 4.4 5.2 8.6
Interconnect costs 6.2 4.5 4.7 15.4
Other direct costs (15.8) 4.4 9.7 (1.7)
Acquisition costs 18.7 6.0 5.8 30.5
Operating expenses (7.4) 4.1 4.8 1.5
Spain
Service revenue for the six months ended 31 March 2008 5.8 10.1 3.1 19.0
Interconnect costs (0.1) 4.1 2.5 6.5
Acquisition costs (9.0) 3.7 1.9 (3.4)
Retention costs 28.3 6.0 0.4 34.7
Operating expenses 4.0 4.5 2.8 11.3
EMAPA
Voice revenue 12.8 2.6 32.0 47.4
Messaging revenue 6.5 6.5 10.5 23.5
Data revenue 87.9 8.9 63.3 160.1
Eastern Europe – interconnect costs 7.5 7.1 6.0 20.6
Eastern Europe – operating expenses 5.7 7.5 12.0 25.2
Eastern Europe – depreciation and amortisation 16.0 8.7 3.7 28.4
Middle East, Africa & Asia – other direct costs 38.0 (9.0) 125.1 154.1
Middle East, Africa & Asia – operating expenses 23.4 (8.6) 97.0 111.8
Middle East, Africa & Asia – depreciation and amortisation 36.3 (5.5) 66.5 97.3
31 March 2007
Group
Voice revenue(1) 2.5 (1.8) 3.8 4.5
Messaging revenue 7.0 (1.3) 3.4 9.1
Data revenue 30.7 (0.8) 0.2 30.1
Europe
Voice revenue(1) (0.6) (0.4) (1.6) (2.6)
Incoming voice revenue (7.4) (0.4) (1.2) (9.0)
Roaming revenue 1.2 (0.4) (2.8) (2.0)
Messaging revenue 4.6 (0.5) (1.0) 3.1
Data revenue 29.5 (0.7) (1.7) 27.1
Other direct costs 16.7 (0.5) (1.3) 14.9
Acquisition and retention costs 0.1 (0.4) (2.2) (2.5)
Operating expenses 7.4 (0.4) (2.8) 4.2
Adjusted operating profit(2) (3.7) (0.5) 0.1 (4.1)
EMAPA
Non-service revenue 28.9 (13.7) 16.3 31.5
Eastern Europe – interconnect costs 23.8 (3.2) 25.7 46.3
Middle East, Africa & Asia – interconnect costs 26.8 (19.0) 37.2 45.0
Notes:
(1) Revenue relating to fixed line activities provided by mobile operators, previously classified within voice revenue, is now presented as fixed line revenue, together with revenue from fixed line
operators and fixed broadband. All prior periods have been adjusted accordingly.
(2) During the year ended 31 March 2008, the Group changed its organisational structure and the Group’s associated undertaking in France, SFR, is now managed within the Europe region and
reported within Other Europe. The results are presented in accordance with the new organisational structure.
Vodafone Group Plc Annual Report 2008 151


