Vodafone 2008 Annual Report Download - page 51
Download and view the complete annual report
Please find page 51 of the 2008 Vodafone annual report below. You can navigate through the pages in the report by either clicking on the pages listed below, or by using the keyword search tool below to find specific information within the annual report.-
 1
1 -
2
-
3
-
4
-
5
-
6
-
7
-
8
-
9
-
10
-
11
-
12
-
13
-
14
-
15
-
16
-
17
-
18
-
19
-
20
-
21
-
22
-
23
-
24
-
25
-
26
-
27
-
28
-
29
-
30
-
31
-
32
-
33
-
34
-
35
-
36
-
37
-
38
-
39
-
40
-
 41
41 -
 42
42 -
 43
43 -
 44
44 -
 45
45 -
 46
46 -
 47
47 -
 48
48 -
 49
49 -
 50
50 -
 51
51 -
 52
52 -
 53
53 -
 54
54 -
 55
55 -
 56
56 -
 57
57 -
 58
58 -
 59
59 -
 60
60 -
 61
61 -
62
-
63
-
64
-
65
-
66
-
67
-
68
-
69
-
70
-
71
-
72
-
73
-
74
-
75
-
76
-
77
-
78
-
79
-
80
-
81
-
82
-
83
-
84
-
85
-
86
-
87
-
88
-
89
-
90
-
91
-
92
-
93
-
94
-
95
-
96
-
97
-
98
-
99
-
100
-
101
-
102
-
103
-
104
-
105
-
106
-
107
-
108
-
109
-
110
-
111
-
112
-
113
-
114
-
115
-
116
-
117
-
118
-
119
-
120
-
121
-
122
-
123
-
124
-
125
-
126
-
127
-
128
-
129
-
130
-
131
-
132
-
133
-
134
-
135
-
136
-
137
-
138
-
139
-
140
-
141
-
142
-
143
-
144
-
145
-
146
-
147
-
148
-
149
-
150
-
151
-
152
-
153
-
154
-
155
-
156
-
157
-
158
-
159
-
160
 |
 |

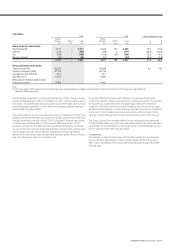
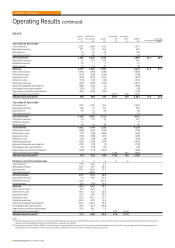
Mobile telecommunications KPIs
2007 2006
Eastern Middle East, Eastern Middle East,
Europe Africa & Asia Pacific EMAPA Europe Africa & Asia Pacific EMAPA
Closing customers (’000) 28,975 27,160 5,750 61,885 12,579 21,884 5,346 39,809
Closing 3G devices (’000) 347 65 758 1,170 135 − 281 416
Voice usage (millions of minutes) 39,658 37,449 11,371 88,478 13,302 18,300 9,811 41,413
See page 155 for definition of terms
A part of Vodafone’s strategy is to build on the Group’s track record of creating
value in emerging markets. Vodafone continued to execute on this strategy, with
strong performances in the Czech Republic, Egypt, Romania and South Africa.
The Group continued to successfully build its emerging markets portfolio through
acquisitions in Turkey and, subsequent to 31 March 2007, India. Since its acquisition
on 24 May 2006, Vodafone Turkey has shown a performance in excess of the
acquisition plan.
In December 2006, the Group increased its equity interest in Vodafone Egypt
from 50.1% to 54.9%, positioning the Group to capture further growth in this
lower penetrated market. The Group also entered into a new strategic partnership
with Telecom Egypt, the minority shareholder in Vodafone Egypt, to increase
cooperation between both parties and jointly develop a range of products and
services for the Egyptian market.
EMAPA’s growth has benefited from the 2006 financial year acquisitions in the
Czech Republic and the stake in Bharti Airtel in India, as well as the stake increases
in Romania and South Africa and the 2007 financial year acquisition in Turkey.
Bharti Airtel was accounted for as a joint venture until 11 February 2007, following
which the Group’s interest has been accounted for as an investment.
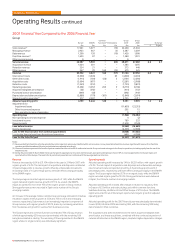
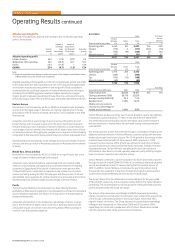
Revenue
Revenue increased by 41.4%, or 21.1% on an organic basis, driven by organic
service revenue growth of 20.4%. The impact of acquisitions, disposal and
exchange rates on service revenue and revenue growth is shown below.
Impact of Impact of
exchange acquisitions
Organic rates and disposal(1) Reported
growth Percentage Percentage growth
% points points %
Service revenue
Eastern Europe 20.0 (5.6) 61.7 76.1
Middle East, Africa and Asia 27.7 (17.7) 33.5 43.5
Pacific 10.0 (7.3) − 2.7
EMAPA 20.4 (10.9) 32.8 42.3
Revenue − EMAPA 21.1 (11.2) 31.5 41.4
Note:
(1) Impact of acquisitions and disposal includes the impact of the change in consolidation status
of Bharti Airtel from a joint venture to an investment.
Organic service revenue growth was driven by the 30.2% organic increase in the
average mobile customer base and the success of usage stimulation initiatives,
partially offset by declining ARPU in a number of markets due to the higher
proportion of lower usage prepaid customer additions.
Particularly strong customer growth was achieved in Eastern Europe and the
Middle East, Africa and Asia, where markets are typically less penetrated than in
Western Europe or the Pacific area.
Non-service revenue increased by 31.5%, or 28.9% on an organic basis, primarily
due to an increase in the level of gross additions in a number of countries.
Eastern Europe
In Eastern Europe, service revenue grew by 76.1%, with the key driver of growth
being the acquisitions in the Czech Republic and Turkey, as well as the stake
increase in Romania. Good customer growth in all Eastern European markets
contributed to the organic service revenue growth.
Organic service revenue growth in Eastern Europe was principally driven by
Romania. As a result of the growth in the customer base and a promotional offer
of lower tariffs, which led to higher voice usage, constant currency service revenue
in Romania grew by 29.4%, calculated by applying the Group’s equity interest at
31 March 2007 to the whole of the 2006 financial year. The continued expansion
of 3G network coverage, the successful launch of 3G broadband, together with
introductory promotional offers, and increased sales of Vodafone Mobile Connect
data cards, resulted in data revenue growth of 66.7% at constant exchange rates.
In the Czech Republic, a focus on existing customers, including a Christmas
campaign of free weekend text messages available to all existing as well as new
customers, and the success of a business offering allowing unlimited on and
off net calls within a customers’ virtual private network for a fixed monthly fee,
had a positive impact on gross additions and drove the increase in average mobile
customers. This led to growth of 11.1% in service revenue at constant exchange
rates, calculated by applying the Group’s equity interest at 31 March 2007 to the
whole of the 2006 financial year.
Vodafone Turkey performed ahead of the expectations the Group had at the time
of the completion of the acquisition, with customer numbers, usage and adjusted
operating profit ahead of plan. Improvements in network reliability and coverage
have contributed to strong customer growth and allowed an increase in prepaid
tariffs, resulting in service revenue growth. Telsim was rebranded to Vodafone
in March 2007, with the launch of a new tariff with inclusive on and off net calls,
a first for the Turkish market.
Middle East, Africa and Asia
The service revenue growth of 43.5% in the Middle East, Africa and Asia resulted
primarily from the stake increases in South Africa in February 2006 and Egypt in
December 2006, together with the acquisition of the Group’s interest in Bharti
Airtel in India in December 2005, offset by an adverse movement in exchange
rates. Strong organic growth was achieved in all markets, particularly in Egypt
and South Africa, driven by the 40.2% increase in the average mobile customer
base compared to the 2006 financial year.
Strong customer growth, driven by prepaid tariff reductions, the availability of
lower cost handsets and high customer satisfaction with the Vodafone service,
contributed to the 39.5% constant currency service revenue growth in Egypt.
Innovative new products and services, including a new hybrid tariff offering
guaranteed airtime credit every month with the ability to top up as required, and
successful promotions, led to an increase in the average mobile customer base
and 21.6% constant currency organic service revenue growth in South Africa,
while the continued rollout of the 3G network led to strong growth in data revenue.
Bharti Airtel continued to perform well with strong growth in customers and
revenue, demonstrating the growth potential in the Indian market.
Pacific
Service revenue increased by 2.7%, with the impact of adverse foreign exchange
movements reducing reported growth by 7.3 percentage points. In Australia, a
continued focus on higher value customers delivered constant currency service
revenue growth of 13.7%, with improvements in both prepaid and contract ARPU.
The performance in Australia more than offset the reduced growth in constant
currency service revenue in New Zealand, where constant currency service
revenue growth was 2.7% following a cut in termination rates, which reduced
reported service revenue growth by 4.1%. After the negative impact of foreign
exchange movements, reported service revenue in New Zealand declined by 7.9%.
Vodafone Group Plc Annual Report 2008 49