Vodafone 2008 Annual Report Download - page 113
Download and view the complete annual report
Please find page 113 of the 2008 Vodafone annual report below. You can navigate through the pages in the report by either clicking on the pages listed below, or by using the keyword search tool below to find specific information within the annual report.-
 1
1 -
2
-
3
-
4
-
5
-
6
-
7
-
8
-
9
-
10
-
11
-
12
-
13
-
14
-
15
-
16
-
17
-
18
-
19
-
20
-
21
-
22
-
23
-
24
-
25
-
26
-
27
-
28
-
29
-
30
-
31
-
32
-
33
-
34
-
35
-
36
-
37
-
38
-
39
-
40
-
41
-
42
-
43
-
44
-
45
-
46
-
47
-
48
-
49
-
50
-
51
-
52
-
53
-
54
-
55
-
56
-
57
-
58
-
59
-
60
-
61
-
62
-
63
-
64
-
65
-
66
-
67
-
68
-
69
-
70
-
71
-
72
-
73
-
74
-
75
-
76
-
77
-
78
-
79
-
80
-
81
-
82
-
83
-
84
-
85
-
86
-
87
-
88
-
89
-
90
-
91
-
92
-
93
-
94
-
95
-
96
-
97
-
98
-
99
-
100
-
101
-
102
-
 103
103 -
 104
104 -
 105
105 -
 106
106 -
 107
107 -
 108
108 -
 109
109 -
 110
110 -
 111
111 -
 112
112 -
 113
113 -
 114
114 -
 115
115 -
 116
116 -
 117
117 -
 118
118 -
 119
119 -
 120
120 -
 121
121 -
 122
122 -
 123
123 -
124
-
125
-
126
-
127
-
128
-
129
-
130
-
131
-
132
-
133
-
134
-
135
-
136
-
137
-
138
-
139
-
140
-
141
-
142
-
143
-
144
-
145
-
146
-
147
-
148
-
149
-
150
-
151
-
152
-
153
-
154
-
155
-
156
-
157
-
158
-
159
-
160
 |
 |
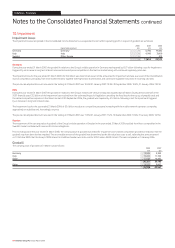
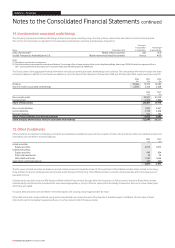
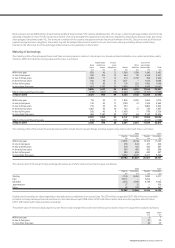
16. Inventory
2008 2007
£m £m
Goods held for resale 417 288
Inventory is reported net of allowances for obsolescence, an analysis of which is as follows:
2008 2007 2006
£m £m £m
1 April 100 97 121
Transfer in respect of discontinued operations – – (40)
Exchange movements 11 (2) 1
Amounts charged to the income statement 7 5 15
31 March 118 100 97
Cost of sales includes amounts related to inventory amounting to £4,320 million (2007: £3,797 million; 2006: £3,662 million).
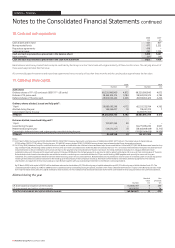
17. Trade and other receivables
2008 2007
£m £m
Included within non-current assets:
Trade receivables 49 42
Other receivables 66 45
Prepayments and accrued income 121 183
Derivative financial instruments 831 224
1,067 494
Included within current assets:
Trade receivables 3,549 2,844
Amounts owed by associated undertakings 21 14
Other receivables 494 226
Prepayments and accrued income 2,426 1,859
Derivative financial instruments 61 80
6,551 5,023
The Group’s trade receivables are stated after allowances for bad and doubtful debts based on management’s assessment of creditworthiness, an analysis of which is
as follows:
2008 2007 2006
£m £m £m
1 April 473 431 474
Transfer in respect of discontinued operations – – (41)
Exchange movements 73 (16) 4
Amounts charged to administrative expenses 293 201 168
Trade receivables written off (175) (143) (174)
31 March 664 473 431
The carrying amounts of trade and other receivables approximate their fair value. Trade and other receivables are predominantly non-interest bearing.
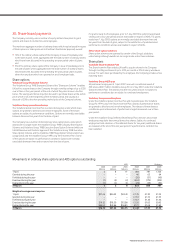
2008 2007
£m £m
Included within “Derivative financial instruments”:
Fair value through the income statement (held for trading):
Interest rate swaps 70 60
Foreign exchange swaps 42 78
112 138
Fair value hedges:
Interest rate swaps 780 166
892 304
The fair values of these financial instruments are calculated by discounting the future cash flows to net present values using appropriate market interest and foreign
currency rates prevailing at 31 March.
Vodafone Group Plc Annual Report 2008 111