Vodafone 2008 Annual Report Download - page 44
Download and view the complete annual report
Please find page 44 of the 2008 Vodafone annual report below. You can navigate through the pages in the report by either clicking on the pages listed below, or by using the keyword search tool below to find specific information within the annual report.-
 1
1 -
2
-
3
-
4
-
5
-
6
-
7
-
8
-
9
-
10
-
11
-
12
-
13
-
14
-
15
-
16
-
17
-
18
-
19
-
20
-
21
-
22
-
23
-
24
-
25
-
26
-
27
-
28
-
29
-
30
-
31
-
32
-
33
-
 34
34 -
 35
35 -
 36
36 -
 37
37 -
 38
38 -
 39
39 -
 40
40 -
 41
41 -
 42
42 -
 43
43 -
 44
44 -
 45
45 -
 46
46 -
 47
47 -
 48
48 -
 49
49 -
 50
50 -
 51
51 -
 52
52 -
 53
53 -
 54
54 -
55
-
56
-
57
-
58
-
59
-
60
-
61
-
62
-
63
-
64
-
65
-
66
-
67
-
68
-
69
-
70
-
71
-
72
-
73
-
74
-
75
-
76
-
77
-
78
-
79
-
80
-
81
-
82
-
83
-
84
-
85
-
86
-
87
-
88
-
89
-
90
-
91
-
92
-
93
-
94
-
95
-
96
-
97
-
98
-
99
-
100
-
101
-
102
-
103
-
104
-
105
-
106
-
107
-
108
-
109
-
110
-
111
-
112
-
113
-
114
-
115
-
116
-
117
-
118
-
119
-
120
-
121
-
122
-
123
-
124
-
125
-
126
-
127
-
128
-
129
-
130
-
131
-
132
-
133
-
134
-
135
-
136
-
137
-
138
-
139
-
140
-
141
-
142
-
143
-
144
-
145
-
146
-
147
-
148
-
149
-
150
-
151
-
152
-
153
-
154
-
155
-
156
-
157
-
158
-
159
-
160
 |
 |

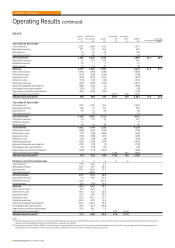
Operating Results continued
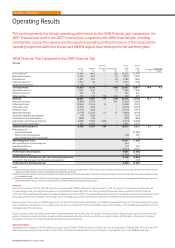
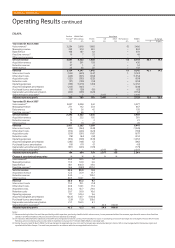
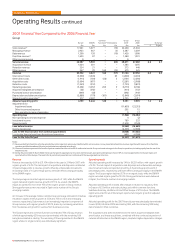
2007 Financial Year Compared to the 2006 Financial Year
Group
Common Group Group
Europe EMAPA Functions(2) Eliminations 2007 2006 % change
£m £m £m £m £m £m £ Organic
Voice revenue(1) 17,261 5,077 − (70) 22,268 21,304
Messaging revenue 2,925 667 − (5) 3,587 3,289
Data revenue 1,300 138 − (10) 1,428 1,098
Fixed line revenue(1) 1,493 87 − − 1,580 1,391
Other service revenue 8 − − − 8 −
Service revenue 22,987 5,969 − (85) 28,871 27,082 6.6 4.7
Acquisition revenue 1,004 381 − − 1,385 1,295
Retention revenue 354 21 − − 375 448
Other revenue 247 70 168 (12) 473 525
Revenue 24,592 6,441 168 (97) 31,104 29,350 6.0 4.3
Interconnect costs (3,668) (1,045) − 85 (4,628) (4,463)
Other direct costs (1,914) (784) (66) 3 (2,761) (2,096)
Acquisition costs (2,604) (677) − − (3,281) (2,968)
Retention costs (1,543) (212) − − (1,755) (1,891)
Operating expenses (5,462) (1,472) 206 9 (6,719) (6,166)
Acquired intangibles amortisation (22) (392) − − (414) (157)
Purchased licence amortisation (849) (43) − − (892) (947)
Depreciation and other amortisation (2,888) (779) (181) − (3,848) (3,674)
Share of result in associates(3) 517 2,207 1 − 2,725 2,411
Adjusted operating profit 6,159 3,244 128 − 9,531 9,399 1.4 4.2
Adjustments for:
Impairment losses (11,600) (23,515)
Other income and expense 502 15
Non-operating income of associates 3 17
Operating loss (1,564) (14,084)
Non-operating income and expense 4 (2)
Investment income 789 353
Financing costs (1,612) (1,120)
Loss before taxation (2,383) (14,853)
Income tax expense (2,423) (2,380)
Loss for the financial year from continuing operations (4,806) (17,233)
Loss for the financial year from discontinued operations (491) (4,588)
Loss for the financial year (5,297) (21,821)
Notes:
(1) Revenue relating to fixed line activities provided by mobile operators, previously classified within voice revenue, is now presented as fixed line revenue, together with revenue from fixed line
operators and fixed broadband. All prior periods have been adjusted accordingly.
(2) Common functions represents the results of partner markets and the net result of unallocated central Group costs and recharges to the Group’s operations, including royalty fees for use of the
Vodafone brand.
(3) During the year ended 31 March 2008, the Group changed its organisational structure and the Group’s associated undertaking in France, SFR, is now managed within the Europe region and
reported within Other Europe. The results for all periods are presented in accordance with the new organisational structure.
Revenue
Revenue increased by 6.0% to £31,104 million in the year to 31 March 2007, with
organic growth of 4.3%. The net impact of acquisitions and disposals contributed
3.3 percentage points to revenue growth, offset by unfavourable movements
in exchange rates of 1.6 percentage points, with both effects arising principally
in the EMAPA region.
The Europe region recorded organic revenue growth of 1.4%, while the EMAPA
region delivered organic revenue growth of 21.1%. As a result, the EMAPA
region accounted for more than 70% of the organic growth in Group revenue.
Strong performances were recorded in Spain and a number of the Group’s
emerging markets.
An increase in the average mobile customer base and usage stimulation initiatives
resulted in organic revenue growth of 2.5% and 7.0% in voice and messaging
revenue, respectively. Data revenue is an increasingly important component of
Group revenue, with organic growth of 30.7%, driven by increasing penetration
from 3G devices and growth in revenue from business services.
The Europe region and common functions contributed 79% of Group revenue,
of which approximately 63% was euro denominated, with the remaining 16%
being denominated in sterling. The remaining 21% was generated in the EMAPA
region where no single currency was individually significant.
Operating result
Adjusted operating profit increased by 1.4% to £9,531 million, with organic growth
of 4.2%. The net impact of acquisitions and disposals and unfavourable exchange
rate movements reduced reported growth by 0.3 percentage points and 2.5
percentage points, respectively, with both effects arising principally in the EMAPA
region. The Europe region declined 3.7% on an organic basis, while the EMAPA
region recorded organic growth of 27.4%. Strong performances were delivered
in Spain, the US and a number of emerging markets.
Adjusted operating profit is stated after charges in relation to regulatory fines
in Greece of £53 million and restructuring costs within common functions,
Vodafone Germany, Vodafone UK and Other Europe of £79 million. The EMAPA
region accounted for all of the Group’s reported and organic growth in adjusted
operating profit.
Adjusted operating profit for the 2007 financial year was principally denominated
in euro (55%), US dollar (22%) and sterling (5%), with the remaining 18% being
denominated in other currencies.
The acquisitions and stake increases led to the rise in acquired intangible asset
amortisation, and these acquisitions, combined with the continued expansion of
network infrastructure in the EMAPA region, resulted in higher depreciation charges.
42 Vodafone Group Plc Annual Report 2008
Vodafone – Performance