Vodafone 2008 Annual Report Download - page 10
Download and view the complete annual report
Please find page 10 of the 2008 Vodafone annual report below. You can navigate through the pages in the report by either clicking on the pages listed below, or by using the keyword search tool below to find specific information within the annual report.-
 1
1 -
 2
2 -
 3
3 -
 4
4 -
 5
5 -
 6
6 -
 7
7 -
 8
8 -
 9
9 -
 10
10 -
 11
11 -
 12
12 -
 13
13 -
 14
14 -
 15
15 -
 16
16 -
 17
17 -
 18
18 -
 19
19 -
 20
20 -
 21
21 -
22
-
23
-
24
-
25
-
26
-
27
-
28
-
29
-
30
-
31
-
32
-
33
-
34
-
35
-
36
-
37
-
38
-
39
-
40
-
41
-
42
-
43
-
44
-
45
-
46
-
47
-
48
-
49
-
50
-
51
-
52
-
53
-
54
-
55
-
56
-
57
-
58
-
59
-
60
-
61
-
62
-
63
-
64
-
65
-
66
-
67
-
68
-
69
-
70
-
71
-
72
-
73
-
74
-
75
-
76
-
77
-
78
-
79
-
80
-
81
-
82
-
83
-
84
-
85
-
86
-
87
-
88
-
89
-
90
-
91
-
92
-
93
-
94
-
95
-
96
-
97
-
98
-
99
-
100
-
101
-
102
-
103
-
104
-
105
-
106
-
107
-
108
-
109
-
110
-
111
-
112
-
113
-
114
-
115
-
116
-
117
-
118
-
119
-
120
-
121
-
122
-
123
-
124
-
125
-
126
-
127
-
128
-
129
-
130
-
131
-
132
-
133
-
134
-
135
-
136
-
137
-
138
-
139
-
140
-
141
-
142
-
143
-
144
-
145
-
146
-
147
-
148
-
149
-
150
-
151
-
152
-
153
-
154
-
155
-
156
-
157
-
158
-
159
-
160
 |
 |

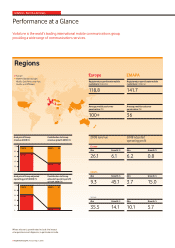
Performance at a Glance
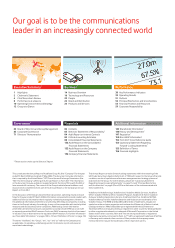
Vodafone is the world’s leading international mobile communications group,
providing a wide range of communications services.
Where relevant, growth rates include the impact
of acquisitions and disposals, in particular in India.
8 Vodafone Group Plc Annual Report 2008
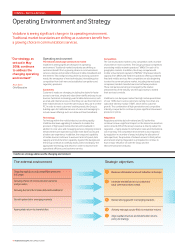
Vodafone – Executive Summary
Regions
100
80
60
40
20
0
100
80
60
40
20
0
Analysis of Group
revenue 2008 (%)
Contribution to Group
revenue growth 2008 (%)
Analysis of Group adjusted
operating profit 2008 (%)
Contribution to Group
adjusted operating profit
growth 2008 (%)
EMAPA 26
Europe 74
EMAPA 37
Europe 62
EMAPA 66
Europe 34
EMAPA 89
Europe 9
Europe EMAPA
2008 revenue 2008 adjusted
operating profit
• Europe
•
EMAPA (Eastern Europe,
Middle East, Africa and Asia,
Pacific and Affiliates)
Registered proportionate mobile
customers (millions)
118.8
Average mobile customer
penetration (%)
100+
Registered proportionate mobile
customers (millions)
141.7
Average mobile customer
penetration (%)
36
Europe
£bn Growth %
26.1 6.1
£bn Growth %
6.2 0.8
EMAPA
£bn Growth %
9.3 45.1
£bn Growth %
3.7 15.0
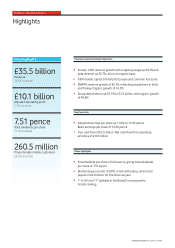
Group
£bn Growth %
35.5 14.1
£bn Growth %
10.1 5.7