Vodafone 2008 Annual Report Download - page 32
Download and view the complete annual report
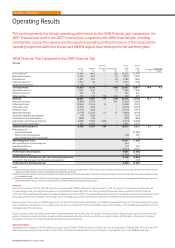
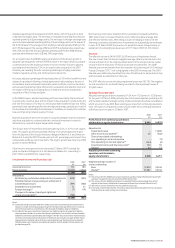
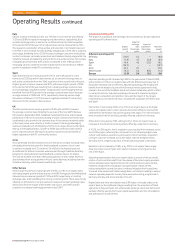
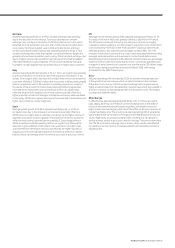
Please find page 32 of the 2008 Vodafone annual report below. You can navigate through the pages in the report by either clicking on the pages listed below, or by using the keyword search tool below to find specific information within the annual report.-
 1
1 -
2
-
3
-
4
-
5
-
6
-
7
-
8
-
9
-
10
-
11
-
12
-
13
-
14
-
15
-
16
-
17
-
18
-
19
-
20
-
21
-
 22
22 -
 23
23 -
 24
24 -
 25
25 -
 26
26 -
 27
27 -
 28
28 -
 29
29 -
 30
30 -
 31
31 -
 32
32 -
 33
33 -
 34
34 -
 35
35 -
 36
36 -
 37
37 -
 38
38 -
 39
39 -
 40
40 -
 41
41 -
 42
42 -
43
-
44
-
45
-
46
-
47
-
48
-
49
-
50
-
51
-
52
-
53
-
54
-
55
-
56
-
57
-
58
-
59
-
60
-
61
-
62
-
63
-
64
-
65
-
66
-
67
-
68
-
69
-
70
-
71
-
72
-
73
-
74
-
75
-
76
-
77
-
78
-
79
-
80
-
81
-
82
-
83
-
84
-
85
-
86
-
87
-
88
-
89
-
90
-
91
-
92
-
93
-
94
-
95
-
96
-
97
-
98
-
99
-
100
-
101
-
102
-
103
-
104
-
105
-
106
-
107
-
108
-
109
-
110
-
111
-
112
-
113
-
114
-
115
-
116
-
117
-
118
-
119
-
120
-
121
-
122
-
123
-
124
-
125
-
126
-
127
-
128
-
129
-
130
-
131
-
132
-
133
-
134
-
135
-
136
-
137
-
138
-
139
-
140
-
141
-
142
-
143
-
144
-
145
-
146
-
147
-
148
-
149
-
150
-
151
-
152
-
153
-
154
-
155
-
156
-
157
-
158
-
159
-
160
 |
 |
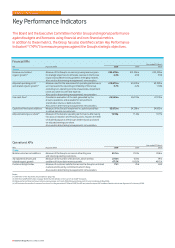
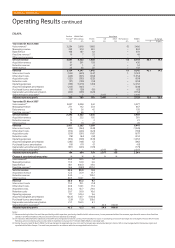
Key Performance Indicators
Financial KPIs
Year ended 31 March
KPI Purpose of KPI 2008 2007 2006
Group
Revenue and related Measure of the Group’s success in growing revenue given £35,478m £31,104m £29,350m
organic growth(2) its strategic objectives to stimulate revenue in the Europe 4.2% 4.3% 7.5%
region and to deliver strong growth in emerging markets.
Also used in determining management’s remuneration.
Adjusted operating profit Measure used for the assessment of operating performance £10,075m £9,531m £9,399m
and related organic growth(2) as it represents the operating profitability of the Group 5.7% 4.2% 11.8%
excluding non-operating income of associates, impairment
losses and other income and expense.
Also used in determining management’s remuneration.
Free cash flow(2) Provides an evaluation of the cash generated by the £5,540m £6,119m £7,119m
Group’s operations and available for reinvestment,
shareholder returns or debt reduction.
Also used in determining management’s remuneration.
Capitalised fixed asset additions Measure of the Group’s investment in capital expenditure £5,075m £4,208m £4,005m
to deliver services to customers.
Adjusted earnings per share(2) Measure of the Group’s operating performance after taking 12.50p 11.26p 10.11p
into account taxation and financing costs. Impacts the level
of dividend payout as the Group’s dividend policy is based
on adjusted earnings per share.
Also used in determining management’s remuneration.
Operational KPIs
Year ended 31 March
KPIs Purpose of KPI 2008 2007 2006
Group
Mobile customer net additions Measure of the Group’s success at attracting new 40.5m 23.9m 26.6m
and retaining existing customers.
3G registered devices and Measure of the number of 3G devices, which are key 27.0m 15.9m 7.9m
related organic growth enablers of future data revenue growth. 67.5% 105.6% 461.1%
Customer delight index Measure of customer satisfaction across the Group’s controlled 73.1 70.6 69.9
markets and its jointly controlled market in Italy.
Also used in determining management’s remuneration.
Notes:
(1) Definition of the key terms are provided on page 155.
(2) See ‘Non-GAAP information’ on page 150 for further details on the use of non-GAAP measures.
(3) Measurement of total communications revenue began on 1 April 2006, following the launch of current strategy in May 2006.
(4) KPI includes the results of common functions. For the year ended 31 March 2006, the KPI excludes the impact of Vodafone Sweden which was disposed of in January 2006.
The Board and the Executive Committee monitor Group and regional performance
against budgets and forecasts using financial and non-financial metrics.
In addition to these metrics, the Group has also identified certain Key Performance
Indicators(1) (“KPIs”) to measure progress against the Group’s strategic objectives.
30 Vodafone Group Plc Annual Report 2008
Vodafone – Performance