Vodafone 2008 Annual Report Download - page 43
Download and view the complete annual report
Please find page 43 of the 2008 Vodafone annual report below. You can navigate through the pages in the report by either clicking on the pages listed below, or by using the keyword search tool below to find specific information within the annual report.-
 1
1 -
2
-
3
-
4
-
5
-
6
-
7
-
8
-
9
-
10
-
11
-
12
-
13
-
14
-
15
-
16
-
17
-
18
-
19
-
20
-
21
-
22
-
23
-
24
-
25
-
26
-
27
-
28
-
29
-
30
-
31
-
32
-
 33
33 -
 34
34 -
 35
35 -
 36
36 -
 37
37 -
 38
38 -
 39
39 -
 40
40 -
 41
41 -
 42
42 -
 43
43 -
 44
44 -
 45
45 -
 46
46 -
 47
47 -
 48
48 -
 49
49 -
 50
50 -
 51
51 -
 52
52 -
 53
53 -
54
-
55
-
56
-
57
-
58
-
59
-
60
-
61
-
62
-
63
-
64
-
65
-
66
-
67
-
68
-
69
-
70
-
71
-
72
-
73
-
74
-
75
-
76
-
77
-
78
-
79
-
80
-
81
-
82
-
83
-
84
-
85
-
86
-
87
-
88
-
89
-
90
-
91
-
92
-
93
-
94
-
95
-
96
-
97
-
98
-
99
-
100
-
101
-
102
-
103
-
104
-
105
-
106
-
107
-
108
-
109
-
110
-
111
-
112
-
113
-
114
-
115
-
116
-
117
-
118
-
119
-
120
-
121
-
122
-
123
-
124
-
125
-
126
-
127
-
128
-
129
-
130
-
131
-
132
-
133
-
134
-
135
-
136
-
137
-
138
-
139
-
140
-
141
-
142
-
143
-
144
-
145
-
146
-
147
-
148
-
149
-
150
-
151
-
152
-
153
-
154
-
155
-
156
-
157
-
158
-
159
-
160
 |
 |

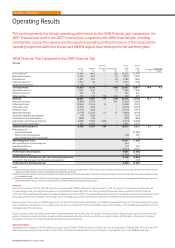
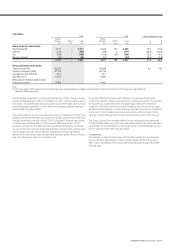
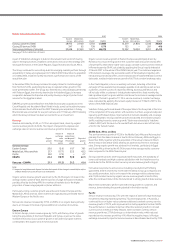
Verizon Wireless increased its closing customer base by 10.6% in the year ended
31 March 2008, adding 6.5 million net additions to reach a total customer base of
67.2 million. The performance was particularly robust in the higher value contract
segment and was achieved in a market where the estimated mobile penetration
reached 88% at 31 March 2008.
The strong customer growth was achieved through a combination of higher gross
additions and Verizon Wireless’ strong customer loyalty, with the latter evidenced
through continuing low levels of churn. The 12.3% growth in the average mobile
customer base combined with a 2.7% increase in ARPU resulted in a 15.2%
increase in service revenue. ARPU growth was achieved through the continued
success of non-voice services, driven predominantly by data cards, wireless email
and messaging services. Verizon Wireless’ operating profit was impacted by
efficiencies in other direct costs and operating expenses, partly offset by a higher
level of customer acquisition and retention costs.
During the 2008 financial year, Verizon Wireless consolidated its spectrum
position through the Federal Communications Commission’s Auction 73, winning
the auction for a nationwide spectrum footprint plus licences for individual
markets for $9.4 billion, which will be fully funded by debt. This spectrum depth
will allow Verizon Wireless to continue to grow revenue, to preserve its reputation
as the nation’s most reliable wireless network, and to continue to lead in data
services to satisfy the next wave of services and consumer electronics devices.
The Group’s share of the tax attributable to Verizon Wireless for the year ended
31 March 2008 relates only to the corporate entities held by the Verizon Wireless
partnership. The tax attributable to the Group’s share of the partnership’s pre-tax
profit is included within the Group tax charge.
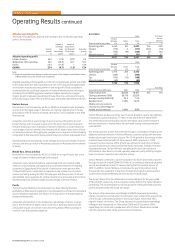
Investments
China Mobile, in which the Group has a 3.21% stake and which is accounted for
as an investment, increased its closing customer base by 24.0% in the year to
392.1 million. Dividends of £72 million were received by the Group in the 2008
financial year.
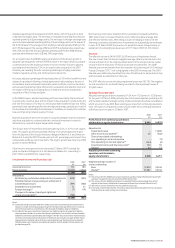
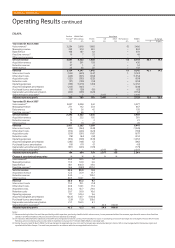
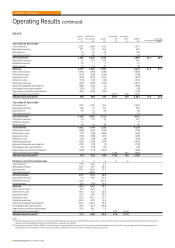
Associates
2008 2007 Verizon Wireless change
Verizon Verizon
Wireless Other(1) Total Wireless Other(1) Total £ $
£m £m £m £m £m £m % %
Share of result of associates
Operating profit 2,771 – 2,771 2,442 167 2,609 13.5 20.3
Interest (102) – (102) (179) 2 (177) (43.0) (39.3)
Tax (166) – (166) (125) (39) (164) 32.8 41.0
Minority interest (56) – (56) (61) – (61) (8.2) (1.8)
2,447 – 2,447 2,077 130 2,207 17.8 24.8
Verizon Wireless (100% basis)
Total revenue (£m) 22,541 20,860 8.1 14.5
Closing customers (’000) 67,178 60,716
Average monthly ARPU ($) 53.9 52.5
Blended churn 14.7% 13.9%
Messaging and data as a percentage
of service revenue 19.8% 14.4%
Note:
(1) Other associates in 2007 include the results of the Group’s associated undertakings in Belgium and Switzerland until the announcement of their disposal in August 2006 and
December 2006, respectively.
Vodafone Group Plc Annual Report 2008 41