Vodafone 2008 Annual Report Download - page 34
Download and view the complete annual report
Please find page 34 of the 2008 Vodafone annual report below. You can navigate through the pages in the report by either clicking on the pages listed below, or by using the keyword search tool below to find specific information within the annual report.-
 1
1 -
2
-
3
-
4
-
5
-
6
-
7
-
8
-
9
-
10
-
11
-
12
-
13
-
14
-
15
-
16
-
17
-
18
-
19
-
20
-
21
-
22
-
23
-
 24
24 -
 25
25 -
 26
26 -
 27
27 -
 28
28 -
 29
29 -
 30
30 -
 31
31 -
 32
32 -
 33
33 -
 34
34 -
 35
35 -
 36
36 -
 37
37 -
 38
38 -
 39
39 -
 40
40 -
 41
41 -
 42
42 -
 43
43 -
 44
44 -
45
-
46
-
47
-
48
-
49
-
50
-
51
-
52
-
53
-
54
-
55
-
56
-
57
-
58
-
59
-
60
-
61
-
62
-
63
-
64
-
65
-
66
-
67
-
68
-
69
-
70
-
71
-
72
-
73
-
74
-
75
-
76
-
77
-
78
-
79
-
80
-
81
-
82
-
83
-
84
-
85
-
86
-
87
-
88
-
89
-
90
-
91
-
92
-
93
-
94
-
95
-
96
-
97
-
98
-
99
-
100
-
101
-
102
-
103
-
104
-
105
-
106
-
107
-
108
-
109
-
110
-
111
-
112
-
113
-
114
-
115
-
116
-
117
-
118
-
119
-
120
-
121
-
122
-
123
-
124
-
125
-
126
-
127
-
128
-
129
-
130
-
131
-
132
-
133
-
134
-
135
-
136
-
137
-
138
-
139
-
140
-
141
-
142
-
143
-
144
-
145
-
146
-
147
-
148
-
149
-
150
-
151
-
152
-
153
-
154
-
155
-
156
-
157
-
158
-
159
-
160
 |
 |

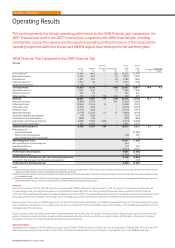
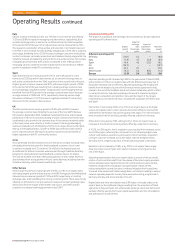
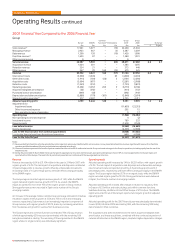
Operating Results
2008 Financial Year Compared to the 2007 Financial Year
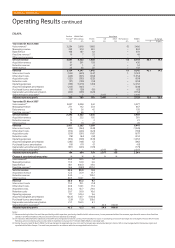
Group
Common Group Group
Europe EMAPA functions(2) Eliminations 2008 2007 % Change
£m £m £m £m £m £m £ organic
Voice revenue(1) 17,485 7,486 − (92) 24,879 22,268
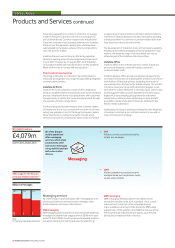
Messaging revenue 3,262 824 − (7) 4,079 3,587
Data revenue 1,827 359 − (6) 2,180 1,428
Fixed line revenue(1) 1,827 48 − (1) 1,874 1,580
Other service revenue 29 1 − − 30 8
Service revenue 24,430 8,718 − (106) 33,042 28,871 14.4 4.3
Acquisition revenue 1,039 450 − (1) 1,488 1,385
Retention revenue 355 34 − − 389 375
Other revenue 257 143 170 (11) 559 473
Revenue 26,081 9,345 170 (118) 35,478 31,104 14.1 4.2
Interconnect costs (3,980) (1,391) − 106 (5,265) (4,628)
Other direct costs (2,064) (1,354) 76 − (3,342) (2,761)
Acquisition costs (2,872) (939) − 1 (3,810) (3,281)
Retention costs (1,756) (259) − − (2,015) (1,755)
Operating expenses (5,719) (2,257) 97 11 (7,868) (6,719)
Acquired intangibles amortisation (78) (648) − − (726) (414)
Purchased licence amortisation (846) (63) − − (909) (892)
Depreciation and other amortisation (2,985) (1,154) (205) − (4,344) (3,848)
Share of result in associates(3) 425 2,449 2 − 2,876 2,725
Adjusted operating profit 6,206 3,729 140 − 10,075 9,531 5.7 5.7
Adjustments for:
Impairment losses − (11,600)
Other income and expense (28) 502
Non-operating income of associates − 3
Operating profit/(loss) 10,047 (1,564)
Non-operating income and expense 254 4
Investment income 714 789
Financing costs (2,014) (1,612)
Profit/(loss) before taxation 9,001 (2,383)
Income tax expense (2,245) (2,423)
Profit/(loss) for the financial year from continuing operations 6,756 (4,806)
Loss for the financial year from discontinued operations − (491)
Profit/(loss) for the financial year 6,756 (5,297)
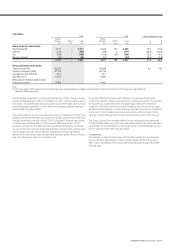
Notes:
(1) Revenue relating to fixed line activities provided by mobile operators, previously classified within voice revenue, is now presented as fixed line revenue, together with revenue from fixed line
operators and fixed broadband. All prior periods have been adjusted accordingly.
(2) Common functions represents the results of the partner markets and the net result of unallocated central Group costs and recharges to the Group’s operations, including royalty fees for use
of the Vodafone brand.
(3) During the year ended 31 March 2008, the Group changed its organisational structure and the Group’s associated undertaking in France, SFR, is now managed within the Europe region and
reported within Other Europe. The results are presented in accordance with the new organisational structure.
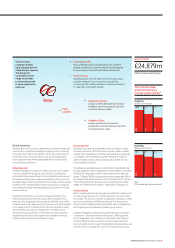
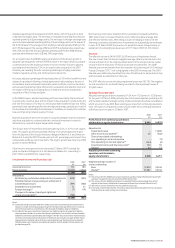
Revenue
Revenue increased by 14.1% to £35,478 million for the year ended 31 March 2008, with organic growth of 4.2%. The impact of acquisitions and disposals was
6.5 percentage points, primarily from acquisitions of subsidiaries in India in May 2007 and Turkey in May 2006 as well as the acquisition of Tele2’s fixed line
communication and broadband operations in Italy and Spain in December 2007. Favourable exchange rate movements increased revenue by 3.4 percentage points,
principally due to the 4.2% change in the average euro/£ exchange rate, as 60% of the Group’s revenue for the 2008 financial year was denominated in euro.
Revenue grew in the Europe and EMAPA regions by 6.1% and 45.1%, respectively, with growth in the EMAPA region benefiting from a 27.5 percentage point impact
from acquisitions and disposals. On an organic basis, Europe recorded growth of 2.0%, while EMAPA delivered an increase of 14.5%. EMAPA accounted for 62.1% of
the organic growth for the Group.
Organic revenue growth was driven by the higher customer base and successful usage stimulation initiatives, partially offset by ongoing price reductions and the
impact of regulatory driven reductions. Growth in data revenue was particularly strong, up 40.6% on an organic basis to £2,180 million, reflecting an increasing
penetration of mobile PC connectivity devices and improved service offerings.
Operating result
Operating profit increased to £10,047 million for the year ended 31 March 2008 from a loss of £1,564 million for the year ended 31 March 2007. The loss in the 2007
financial year was mainly the result of the £11,600 million of impairment charges that occurred in the year, compared with none in the 2008 financial year.
This section presents the Group’s operating performance for the 2008 financial year compared to the
2007 financial year and for the 2007 financial year compared to the 2006 financial year, providing
commentary on how the revenue and the adjusted operating profit performance of the Group and its
operating segments within the Europe and EMAPA regions have developed in the last three years.
32 Vodafone Group Plc Annual Report 2008
Vodafone – Performance