Vodafone 2008 Annual Report Download - page 45
Download and view the complete annual report
Please find page 45 of the 2008 Vodafone annual report below. You can navigate through the pages in the report by either clicking on the pages listed below, or by using the keyword search tool below to find specific information within the annual report.-
 1
1 -
2
-
3
-
4
-
5
-
6
-
7
-
8
-
9
-
10
-
11
-
12
-
13
-
14
-
15
-
16
-
17
-
18
-
19
-
20
-
21
-
22
-
23
-
24
-
25
-
26
-
27
-
28
-
29
-
30
-
31
-
32
-
33
-
34
-
 35
35 -
 36
36 -
 37
37 -
 38
38 -
 39
39 -
 40
40 -
 41
41 -
 42
42 -
 43
43 -
 44
44 -
 45
45 -
 46
46 -
 47
47 -
 48
48 -
 49
49 -
 50
50 -
 51
51 -
 52
52 -
 53
53 -
 54
54 -
 55
55 -
56
-
57
-
58
-
59
-
60
-
61
-
62
-
63
-
64
-
65
-
66
-
67
-
68
-
69
-
70
-
71
-
72
-
73
-
74
-
75
-
76
-
77
-
78
-
79
-
80
-
81
-
82
-
83
-
84
-
85
-
86
-
87
-
88
-
89
-
90
-
91
-
92
-
93
-
94
-
95
-
96
-
97
-
98
-
99
-
100
-
101
-
102
-
103
-
104
-
105
-
106
-
107
-
108
-
109
-
110
-
111
-
112
-
113
-
114
-
115
-
116
-
117
-
118
-
119
-
120
-
121
-
122
-
123
-
124
-
125
-
126
-
127
-
128
-
129
-
130
-
131
-
132
-
133
-
134
-
135
-
136
-
137
-
138
-
139
-
140
-
141
-
142
-
143
-
144
-
145
-
146
-
147
-
148
-
149
-
150
-
151
-
152
-
153
-
154
-
155
-
156
-
157
-
158
-
159
-
160
 |
 |

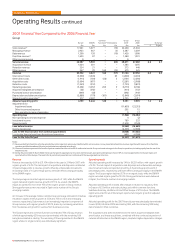
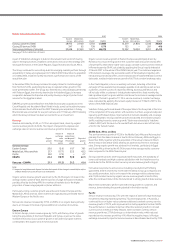
The Group’s share of results from associates increased by 13.0%, mainly due to
Verizon Wireless which reported record growth in net additions and increased
ARPU. The growth in Verizon Wireless was offset by a reduction in the Group’s
share of results from its other associated undertakings, which fell due to the
disposals of Belgacom Mobile S.A. and Swisscom Mobile A.G. as well as the
impact of reductions in termination rates and intense competition experienced
by SFR in France.
Operating loss was £1,564 million compared with a loss of £14,084 million in
the 2006 financial year following lower impairment charges. In the year ended
31 March 2007, the Group recorded an impairment charge of £11,600 million
(2006: £23,515 million) in relation to the carrying value of goodwill in the Group’s
operations in Germany (£6,700 million) and Italy (£4,900 million). The impairment
in Germany resulted from an increase in long term interest rates, which led to
higher discount rates, along with increased price competition and continued
regulatory pressures in the German market. The impairment in Italy resulted from
an increase in long term interest rates and the estimated impact of legislation
cancelling the fixed fees for the top up of prepaid cards and the related competitive
response in the Italian market. The increase in interest rates accounted for £3,700
million of the reduction in value during the 2007 financial year.
Certain of the Group’s cost reduction and revenue stimulation initiatives are
managed centrally within common functions. Consequently, operating and
capital expenses are incurred centrally and recharged to the relevant countries,
primarily in Europe. This typically results in higher operating expenses with
a corresponding reduction in depreciation for the countries concerned.
Other income and expense for the year ended 31 March 2007 included the gains
on disposal of Belgacom Mobile S.A. and Swisscom Mobile A.G., amounting to
£441 million and £68 million, respectively.
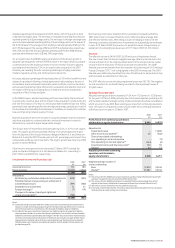
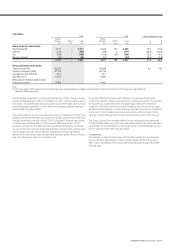
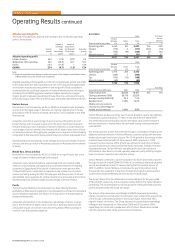
Investment income and financing costs
2007 2006
£m £m
Investment income 789 353
Financing costs (1,612) (1,120)
(823) (767)
Analysed as:
Net financing costs before dividends from investments(1) (435) (318)
Potential interest charges arising on settlement of
outstanding tax issues (406) (329)
Dividends from investments 57 41
Foreign exchange(2) (41) –
Changes in the fair value of equity put rights and
similar arrangements(3) 2 (161)
Net financing costs (823) (767)
Notes:
(1) Includes a one off gain of £86 million related to the Group renegotiating its investments in
SoftBank.
(2) Comprises foreign exchange differences reflected in the Consolidated Income Statement in
relation to certain intercompany balances and the foreign exchange differences on financial
instruments received as consideration in the disposal of Vodafone Japan to SoftBank, which
completed in April 2006.
(3) Includes the fair value movement in relation to the put rights and similar arrangements held
by minority interest holders in certain of the Group’s subsidiaries. The valuation of these
financial liabilities is inherently unpredictable and changes in the fair value could have a
material impact on the future results and financial position of Vodafone. Details of these
options can be found on page 58.
Net financing costs before dividends from investments increased by 36.8% to
£435 million as increased financing costs, reflecting higher average debt and
interest rates, and losses on mark to market adjustments on financial instruments
more than offset higher investment income resulting from new investments in
SoftBank, which arose on the sale of Vodafone Japan during the 2007 financial year,
including an £86 million gain related to the renegotiation of these investments.
At 31 March 2007, the provision for potential interest charges arising on settlement
of outstanding tax issues was £1,213 million.
Taxation
The effective tax rate, exclusive of impairment losses, was 26.3% (2006: 27.5%),
which was lower than the Group’s weighted average tax rate due to the
resolution of a number of historic tax issues with tax authorities and additional
tax deductions in Italy. The 2006 financial year benefited from the tax treatment
of a share repurchase in Vodafone Italy and favourable tax settlements.
A significant event in the 2007 financial year was a European Court decision in
respect of the UK CFC legislation, following which Vodafone has not accrued any
additional provision in respect of the application of UK CFC legislation to the Group.
The effective tax rate including impairment losses was (101.7)% compared to
(16.0)% for the 2006 financial year. The negative tax rates arose from no tax
benefit being recorded for the impairment losses of £11,600 million (2006:
£23,515 million).
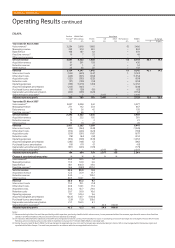
Loss per share
Adjusted earnings per share increased by 11.4% from 10.11 pence to 11.26 pence
for the year to 31 March 2007. Basic loss per share from continuing operations
decreased from 27.66 pence to 8.94 pence for the year ended 31 March 2007.
2007 2006
£m £m
Loss from continuing operations
attributable to equity shareholders (4,932) (17,318)
Adjustments:
Impairment losses(1) 11,600 23,515
Other income and expense (502) (15)
Share of associated undertakings’
non-operating income (3) (17)
Non-operating income and expense (4) 2
Investment income and financing costs(2) 39 161
Tax on the above items 13 –
Adjusted profit from continuing
operations attributable to
equity shareholders 6,211 6,328
Weighted average number of
shares outstanding
Basic and diluted(3) 55,144 62,607
Notes:
(1) See note 10 to the Consolidated Financial Statements.
(2) See note 2 and 3 in investment income and financing costs.
(3) In the year ended 31 March 2007, 215 million (2006: 183 million) shares have been excluded
from the calculation of diluted loss per share as they are not dilutive.
Vodafone Group Plc Annual Report 2008 43