Vodafone 2008 Annual Report Download - page 119
Download and view the complete annual report
Please find page 119 of the 2008 Vodafone annual report below. You can navigate through the pages in the report by either clicking on the pages listed below, or by using the keyword search tool below to find specific information within the annual report.-
 1
1 -
2
-
3
-
4
-
5
-
6
-
7
-
8
-
9
-
10
-
11
-
12
-
13
-
14
-
15
-
16
-
17
-
18
-
19
-
20
-
21
-
22
-
23
-
24
-
25
-
26
-
27
-
28
-
29
-
30
-
31
-
32
-
33
-
34
-
35
-
36
-
37
-
38
-
39
-
40
-
41
-
42
-
43
-
44
-
45
-
46
-
47
-
48
-
49
-
50
-
51
-
52
-
53
-
54
-
55
-
56
-
57
-
58
-
59
-
60
-
61
-
62
-
63
-
64
-
65
-
66
-
67
-
68
-
69
-
70
-
71
-
72
-
73
-
74
-
75
-
76
-
77
-
78
-
79
-
80
-
81
-
82
-
83
-
84
-
85
-
86
-
87
-
88
-
89
-
90
-
91
-
92
-
93
-
94
-
95
-
96
-
97
-
98
-
99
-
100
-
101
-
102
-
103
-
104
-
105
-
106
-
107
-
108
-
 109
109 -
 110
110 -
 111
111 -
 112
112 -
 113
113 -
 114
114 -
 115
115 -
 116
116 -
 117
117 -
 118
118 -
 119
119 -
 120
120 -
 121
121 -
 122
122 -
 123
123 -
 124
124 -
 125
125 -
 126
126 -
 127
127 -
 128
128 -
 129
129 -
130
-
131
-
132
-
133
-
134
-
135
-
136
-
137
-
138
-
139
-
140
-
141
-
142
-
143
-
144
-
145
-
146
-
147
-
148
-
149
-
150
-
151
-
152
-
153
-
154
-
155
-
156
-
157
-
158
-
159
-
160
 |
 |
would reduce or increase profit before tax by approximately £3 million (2007:
increase or reduce by £24 million), including mark-to-market revaluations of
interest rate and other derivatives and the potential interest on outstanding
tax issues. There would be no material impact on equity.
Foreign exchange management
As Vodafone’s primary listing is on the London Stock Exchange, its share price is
quoted in sterling. Since the sterling share price represents the value of its future
multi-currency cash flows, principally in euro, sterling and US dollars, the Group
maintains the currency of debt and interest charges in proportion to its expected
future principal multi-currency cash flows and has a policy to hedge external
foreign exchange risks on transactions denominated in other currencies above
certain de minimis levels. As the Group’s future cash flows are increasingly likely
to be derived from emerging markets, it is likely that more debt in emerging
market currencies will be drawn.
As such, at 31 March 2008, 119% of net debt was denominated in currencies other
than sterling (80% euro, 27% US dollar and 12% other), while 19% of net debt
had been purchased forward in sterling in anticipation of sterling denominated
shareholder returns via dividends. This allows euro, US dollar and other debt to
be serviced in proportion to expected future cash flows and, therefore, provides
a partial hedge against income statement translation exposure, as interest costs
will be denominated in foreign currencies. Yen debt is used as a hedge against the
value of yen assets as the Group has minimal yen cash flows. A relative weakening
in the value of sterling against certain currencies in which the Group maintains
cash and cash equivalents has resulted in an increase in cash and cash
equivalents of £129 million from currency translation differences.
Under the Group’s foreign exchange management policy, foreign exchange
transaction exposure in Group companies is generally maintained at the lower
of €5 million per currency per month or €15 million per currency over a six
month period. The Group is exposed to profit and loss account volatility on the
retranslation of certain investments received upon the disposal of Vodafone
Japan to SoftBank which are yen denominated financial instruments but are
owned by legal entities with either a sterling or euro functional currency. In addition,
a US dollar denominated financial liability arising from the put rights granted over
the Essar Group’s interests in Vodafone Essar in the 2008 financial year and discussed
on page 118, were granted by a legal entity with a euro functional currency.
A 10%, 2% or 1% (2007: 2%, 5% or nil) change in the ¥/£, ¥/€ or US$/€ exchange
rates would have a £47 million, £17 million or £23 million (2007: £8 million, £33
million and nil) impact on profit or loss in relation to these financial instruments.
The Group recognises foreign exchange movements in equity for the translation of
net investment hedging instruments and balances treated as investments in foreign
operations. However, there is no net impact on equity for exchange rate movements
as there would be an offset in the currency translation of the foreign operation.
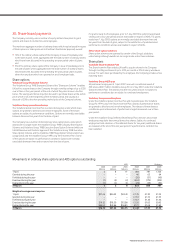
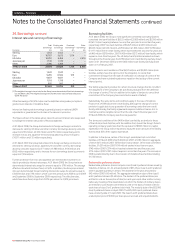
The following table details the Group’s sensitivity of the Group’s adjusted operating
profit to a strengthening of the Group’s major currencies in which it transacts.
The percentage movement applied to each currency is based on the average
movements in the previous three annual reporting periods. The analysis has been
performed based on the movement occurring at the start of the reporting period
and is calculated by retranslating the adjusted operating profit of each entity
whose functional currency is either euro or US dollar.
2008
£m
Euro 6% change – Adjusted operating profit 357
US dollar 7% change – Adjusted operating profit 177
At 31 March 2007, sensitivity of the Group’s adjusted operating profit was
analysed for euro 3% change and US$ 8% change, representing £175 million and
£176 million respectively.
Equity risk
The Group has equity investments, primarily in China Mobile Limited and Bharti
Infotel Private Limited, which are subject to equity risk. See note 15 for further
details on the carrying value of these investments.
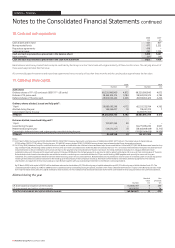
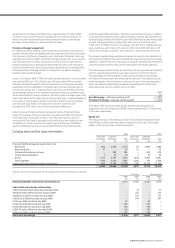
Carrying value and fair value information
2008 2007
Short term Long term Short term Long term
borrowings borrowings Total borrowings borrowings Total
£m £m £m £m £m £m
Financial liabilities measured at amortised cost:
Bank loans 806 2,669 3,475 94 2,086 2,180
Bank overdrafts 47 – 47 23 – 23
Redeemable preference shares – 985 985 – 818 818
Finance lease obligations 9 60 69 7 59 66
Bonds 1,125 4,439 5,564 1,648 3,953 5,601
Other liabilities 1,740 2,945 4,685 2,202 156 2,358
Loans and bonds in fair value hedge relationships 805 11,564 12,369 843 10,726 11,569
4,532 22,662 27,194 4,817 17,798 22,615
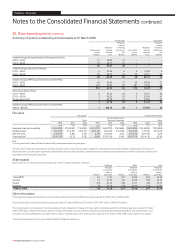
The fair value and carrying value of the Group’s short term borrowings is as follows:
Fair value Carrying value
2008 2007 2008 2007
£m £m £m £m
Financial liabilities measured at amortised cost 3,715 3,972 3,727 3,974
Loans in fair value hedge relationships:
4.161% US dollar 150m bond due November 2007 – 76 – 77
3.95% US dollar 500m bond due January 2008 – 252 – 254
4.625% euro 250m bond due January 2008 – 170 – 171
4.625% euro 500m bond due January 2008 – 341 – 341
5.5% euro 400m bond due July 2008 37 – 39 –
6.25% sterling 250m bond due July 2008 250 – 249 –
6.25% sterling 150m bond due July 2008 150 – 148 –
6.65% US dollar 500m bond due May 2008 126 – 130 –
4.0% euro 300m bond due January 2009 237 – 239 –
Short term borrowings 4,515 4,811 4,532 4,817
Vodafone Group Plc Annual Report 2008 117