Vodafone 2008 Annual Report Download - page 120
Download and view the complete annual report
Please find page 120 of the 2008 Vodafone annual report below. You can navigate through the pages in the report by either clicking on the pages listed below, or by using the keyword search tool below to find specific information within the annual report.-
 1
1 -
2
-
3
-
4
-
5
-
6
-
7
-
8
-
9
-
10
-
11
-
12
-
13
-
14
-
15
-
16
-
17
-
18
-
19
-
20
-
21
-
22
-
23
-
24
-
25
-
26
-
27
-
28
-
29
-
30
-
31
-
32
-
33
-
34
-
35
-
36
-
37
-
38
-
39
-
40
-
41
-
42
-
43
-
44
-
45
-
46
-
47
-
48
-
49
-
50
-
51
-
52
-
53
-
54
-
55
-
56
-
57
-
58
-
59
-
60
-
61
-
62
-
63
-
64
-
65
-
66
-
67
-
68
-
69
-
70
-
71
-
72
-
73
-
74
-
75
-
76
-
77
-
78
-
79
-
80
-
81
-
82
-
83
-
84
-
85
-
86
-
87
-
88
-
89
-
90
-
91
-
92
-
93
-
94
-
95
-
96
-
97
-
98
-
99
-
100
-
101
-
102
-
103
-
104
-
105
-
106
-
107
-
108
-
109
-
 110
110 -
 111
111 -
 112
112 -
 113
113 -
 114
114 -
 115
115 -
 116
116 -
 117
117 -
 118
118 -
 119
119 -
 120
120 -
 121
121 -
 122
122 -
 123
123 -
 124
124 -
 125
125 -
 126
126 -
 127
127 -
 128
128 -
 129
129 -
 130
130 -
131
-
132
-
133
-
134
-
135
-
136
-
137
-
138
-
139
-
140
-
141
-
142
-
143
-
144
-
145
-
146
-
147
-
148
-
149
-
150
-
151
-
152
-
153
-
154
-
155
-
156
-
157
-
158
-
159
-
160
 |
 |

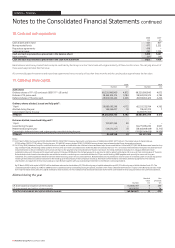
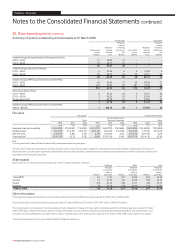
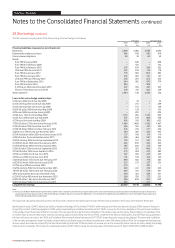
24. Borrowings continued
The fair value and carrying value of the Group’s long term borrowings is as follows:
Fair value Carrying value
2008 2007 2008 2007
£m £m £m £m
Financial liabilities measured at amortised cost:
Bank loans 2,669 2,086 2,669 2,086
Redeemable preference shares 985 818 985 818
Finance lease obligations 60 59 60 59
Bonds:
Euro FRN due July 2008 – 849 – 858
Euro FRN due February 2009 – 102 – 102
Euro FRN due February 2010 237 204 240 205
US dollar FRN due June 2011 227 224 176 178
Euro FRN due January 2012 775 683 805 685
Euro FRN due January 2012 232 205 241 197
US dollar FRN due February 2012 236 254 253 255
Euro FRN due September 2013 644 582 679 579
Euro FRN due June 2014 930 – 998 –
5.125% euro 500m bond due April 2015 397 350 427 365
5% euro 750m bond due June 2018 578 515 620 529
Other liabilities(1) 2,984 156 2,945 156
Loans in fair value hedge relationships:
5.5% euro 400m bond due July 2008 – 32 – 34
6.25% sterling 250m bond due July 2008 – 251 – 249
6.25% sterling 150m bond due July 2008 – 151 – 149
6.65% US dollar 500m bond due May 2008 – 129 – 132
4.0% euro 300m bond due January 2009 – 203 – 204
4.25% euro 1.4bn bond due May 2009 1,112 950 1,135 965
4.25% euro 500m bond due May 2009 397 339 408 348
4.75% euro 3bn bond due May 2009 695 596 709 602
7.75% US dollar 2.75bn bond due February 2010 1,466 1,480 1,492 1,467
5.5% US dollar 750m bond due June 2011 386 385 410 390
5.35% US dollar 500m bond due February 2012 255 255 271 256
3.625% euro 750m bond due November 2012 564 487 584 492
6.75% Australian dollar 265m bond due January 2013 121 108 119 110
5.0% US dollar 1bn bond due December 2013 532 464 541 502
4.625% sterling 350m bond due September 2014 319 321 347 334
5.375% US dollar 500m bond due January 2015 256 250 268 249
5.375% US dollar 400m bond due January 2015 205 200 215 199
5.0% US dollar 750m bond due September 2015 419 423 406 375
5.75% US dollar 750m bond due March 2016 375 384 415 384
4.75% euro 300m bond due June 2016 227 204 245 209
4.75% euro 200m bond due June 2016 151 136 164 140
5.625% US dollar 1.3bn bond due February 2017 640 650 716 661
4.625% US dollar 500m bond due July 2018 227 231 257 235
5.375% euro 500m bond June 2022 374 – 420 –
5.625% sterling 250m bond due December 2025 220 242 259 253
7.875% US dollar 750m bond due February 2030 409 441 514 481
5.9% sterling 450m bond due November 2032 410 454 458 451
6.25% US dollar 495m bond due November 2032 258 250 275 252
6.15% US dollar 1.2bn bond due February 2037 568 609 665 603
6.15% US dollar 500m bond due February 2037 237 – 271 –
Long term borrowings 21,777 17,712 22,662 17,798
Note:
(1) Amount at 31 March 2008 includes £2,476 million (2007 : £nil) in relation to the written put options disclosed in note 12 and written put options granted to the Essar Group that, if exercised,
would allow the Essar Group to sell its 33% shareholding in Vodafone Essar to the Group for US$5 billion or to sell between US$1 billion and US$5 billion worth of Vodafone Essar shares at an
independently appraised fair market value.
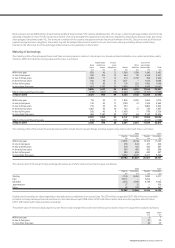
Fair values are calculated using discounted cash flows with a discount rate based upon forward interest rates available to the Group at the balance sheet date.
Banks loans include a ZAR7.2 billion loan held by Vodafone Holdings SA Pty Limited (“VHSA”), which directly and indirectly owns the Group’s 50% interest in Vodacom
Group (Pty) Limited. VHSA has pledged its 100% equity shareholding in Vodafone Investments SA (“VISA”) as security for its loan obligations. The terms and conditions
of the pledge mean that should VHSA not meet all of its loan payment and performance obligations, the lenders may sell the equity shareholding in its subsidiary VISA
at market value to recover their losses, with any remaining sales proceeds being returned to VHSA. Vodafone International Holdings B.V. and VISA have also guaranteed
this loan with recourse only to the VHSA and Vodafone Telecommunications Investment SA (“VTISA”) shares they have respectively pledged. The terms and conditions
of the security arrangement mean the lenders may be able to sell these respective shares in preference to the VISA shares held by VHSA. An arrangement has been put
in place where the Vodacom Group (Pty) Limited shares held by VHSA and VTISA are held in an escrow account to ensure the shares cannot be sold to satisfy the pledge
made by both companies. The maximum collateral provided is ZAR7.5 billion, being the carrying value of the bank loan at 31 March 2008 (2007: ZAR8.6 billion).
118 Vodafone Group Plc Annual Report 2008
Notes to the Consolidated Financial Statements continued
Vodafone – Financials