Vodafone 2008 Annual Report Download - page 40
Download and view the complete annual report
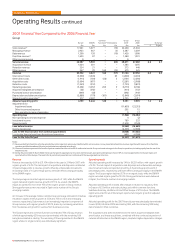
Please find page 40 of the 2008 Vodafone annual report below. You can navigate through the pages in the report by either clicking on the pages listed below, or by using the keyword search tool below to find specific information within the annual report.-
 1
1 -
2
-
3
-
4
-
5
-
6
-
7
-
8
-
9
-
10
-
11
-
12
-
13
-
14
-
15
-
16
-
17
-
18
-
19
-
20
-
21
-
22
-
23
-
24
-
25
-
26
-
27
-
28
-
29
-
 30
30 -
 31
31 -
 32
32 -
 33
33 -
 34
34 -
 35
35 -
 36
36 -
 37
37 -
 38
38 -
 39
39 -
 40
40 -
 41
41 -
 42
42 -
 43
43 -
 44
44 -
 45
45 -
 46
46 -
 47
47 -
 48
48 -
 49
49 -
 50
50 -
51
-
52
-
53
-
54
-
55
-
56
-
57
-
58
-
59
-
60
-
61
-
62
-
63
-
64
-
65
-
66
-
67
-
68
-
69
-
70
-
71
-
72
-
73
-
74
-
75
-
76
-
77
-
78
-
79
-
80
-
81
-
82
-
83
-
84
-
85
-
86
-
87
-
88
-
89
-
90
-
91
-
92
-
93
-
94
-
95
-
96
-
97
-
98
-
99
-
100
-
101
-
102
-
103
-
104
-
105
-
106
-
107
-
108
-
109
-
110
-
111
-
112
-
113
-
114
-
115
-
116
-
117
-
118
-
119
-
120
-
121
-
122
-
123
-
124
-
125
-
126
-
127
-
128
-
129
-
130
-
131
-
132
-
133
-
134
-
135
-
136
-
137
-
138
-
139
-
140
-
141
-
142
-
143
-
144
-
145
-
146
-
147
-
148
-
149
-
150
-
151
-
152
-
153
-
154
-
155
-
156
-
157
-
158
-
159
-
160
 |
 |

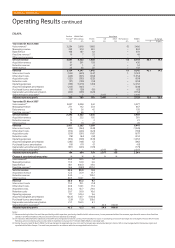
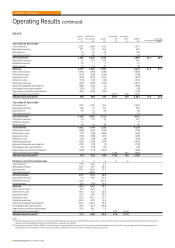
EMAPA
Eastern Middle East, Associates
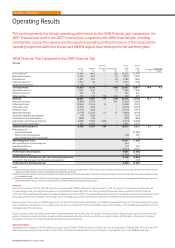
Europe(2) Africa & Asia Pacific US Other Eliminations EMAPA % change
£m £m £m £m £m £m £m £ Organic(2)
Year ended 31 March 2008
Voice revenue(1) 2,584 3,818 1,085 (1) 7,486
Messaging revenue 333 210 281 – 824
Data revenue 108 187 64 – 359
Fixed line revenue(1) 16 7 25 – 48
Other service revenue – – 1 – 1
Service revenue 3,041 4,222 1,456 (1) 8,718 46.1 14.4
Acquisition revenue 61 261 128 – 450
Retention revenue 27 1 6 – 34
Other revenue 25 63 55 – 143
Revenue 3,154 4,547 1,645 (1) 9,345 45.1 14.5
Interconnect costs (522) (623) (247) 1 (1,391)
Other direct costs (445) (625) (284) – (1,354)
Acquisition costs (322) (395) (222) – (939)
Retention costs (97) (103) (59) – (259)
Operating expenses (769) (1,078) (410) – (2,257)
Acquired intangibles amortisation (223) (425) – – (648)
Purchased licence amortisation (19) (28) (16) – (63)
Depreciation and other amortisation (425) (503) (226) – (1,154)
Share of result in associates(3) – 2 – 2,447 – – 2,449
Adjusted operating profit 332 769 181 2,447 – – 3,729 15.0 20.9
Year ended 31 March 2007
Voice revenue(1) 2,037 2,098 942 5,077
Messaging revenue 271 142 254 667
Data revenue 70 26 42 138
Fixed line revenue(1) 14 66 7 87
Service revenue 2,392 2,332 1,245 5,969
Acquisition revenue 53 223 105 381
Retention revenue 19 – 2 21
Other revenue 13 10 47 70
Revenue 2,477 2,565 1,399 6,441
Interconnect costs (433) (364) (248) (1,045)
Other direct costs (314) (246) (224) (784)
Acquisition costs (219) (291) (167) (677)
Retention costs (78) (84) (50) (212)
Operating expenses (614) (509) (349) (1,472)
Acquired intangibles amortisation (285) (105) (2) (392)
Purchased licence amortisation (19) (17) (7) (43)
Depreciation and other amortisation (331) (255) (193) (779)
Share of result in associates(3) – – – 2,077 130 2,207
Adjusted operating profit 184 694 159 2,077 130 3,244
Change at constant exchange rates % % % % %
Voice revenue(1) 20.3 90.3 7.0
Messaging revenue 13.2 53.8 2.6
Data revenue 48.1 646.0 43.0
Fixed line revenue(1) 16.4 (89.9) 201.2
Service revenue 20.2 88.6 8.6
Acquisition revenue 12.3 25.9 13.7
Retention revenue 34.0 – 195.2
Other revenue 80.3 569.1 7.8
Revenue 20.5 85.2 9.2
Interconnect costs 13.5 78.1 (7.4)
Other direct costs 29.8 163.1 17.4
Acquisition costs 36.6 45.7 24.0
Retention costs 20.7 30.0 10.6
Operating expenses 17.7 120.4 9.6
Acquired intangibles amortisation (26.4) 316.7 (100.0)
Purchased licence amortisation (5.0) 75.0 128.6
Depreciation and other amortisation 21.1 104.5 8.1
Share of result in associates(3) – – – 24.8 (100.0)
Adjusted operating profit 93.3 15.3 4.6 24.8 (100.0)
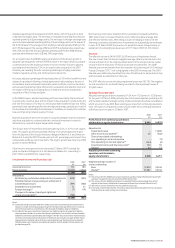
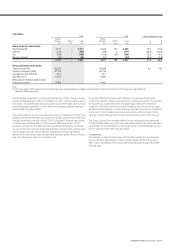
Notes:
(1) Revenue relating to fixed line activities provided by mobile operators, previously classified within voice revenue, is now presented as fixed line revenue, together with revenue from fixed line
operators and fixed broadband. All prior periods have been adjusted accordingly.
(2) On 1 October 2007, Romania rebased all of its tariffs and changed its functional currency from US dollars to euros. In calculating all constant exchange rate and organic metrics which include
Romania, previous US dollar amounts have been translated into euros at the 1 October 2007 US$/euro exchange rate.
(3) During the year ended 31 March 2008, the Group changed its organisational structure and the Group’s associated undertaking in France, SFR, is now managed within the Europe region and
reported within Other Europe. The results are presented in accordance with the new organisational structure.
Operating Results continued
38 Vodafone Group Plc Annual Report 2008
Vodafone – Performance
Vodafone – Performance