Vodafone 2008 Annual Report Download - page 35
Download and view the complete annual report
Please find page 35 of the 2008 Vodafone annual report below. You can navigate through the pages in the report by either clicking on the pages listed below, or by using the keyword search tool below to find specific information within the annual report.-
 1
1 -
2
-
3
-
4
-
5
-
6
-
7
-
8
-
9
-
10
-
11
-
12
-
13
-
14
-
15
-
16
-
17
-
18
-
19
-
20
-
21
-
22
-
23
-
24
-
 25
25 -
 26
26 -
 27
27 -
 28
28 -
 29
29 -
 30
30 -
 31
31 -
 32
32 -
 33
33 -
 34
34 -
 35
35 -
 36
36 -
 37
37 -
 38
38 -
 39
39 -
 40
40 -
 41
41 -
 42
42 -
 43
43 -
 44
44 -
 45
45 -
46
-
47
-
48
-
49
-
50
-
51
-
52
-
53
-
54
-
55
-
56
-
57
-
58
-
59
-
60
-
61
-
62
-
63
-
64
-
65
-
66
-
67
-
68
-
69
-
70
-
71
-
72
-
73
-
74
-
75
-
76
-
77
-
78
-
79
-
80
-
81
-
82
-
83
-
84
-
85
-
86
-
87
-
88
-
89
-
90
-
91
-
92
-
93
-
94
-
95
-
96
-
97
-
98
-
99
-
100
-
101
-
102
-
103
-
104
-
105
-
106
-
107
-
108
-
109
-
110
-
111
-
112
-
113
-
114
-
115
-
116
-
117
-
118
-
119
-
120
-
121
-
122
-
123
-
124
-
125
-
126
-
127
-
128
-
129
-
130
-
131
-
132
-
133
-
134
-
135
-
136
-
137
-
138
-
139
-
140
-
141
-
142
-
143
-
144
-
145
-
146
-
147
-
148
-
149
-
150
-
151
-
152
-
153
-
154
-
155
-
156
-
157
-
158
-
159
-
160
 |
 |

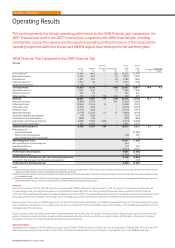
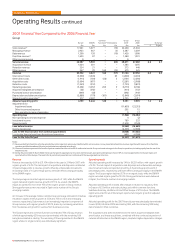
Adjusted operating profit increased to £10,075 million, with 5.7% growth on both
a reported and organic basis. The net impact of acquisitions and disposals reduced
reported growth by 0.8 percentage points. The net impact of foreign exchange rates
was to increase adjusted operating profit by 0.8 percentage points, as the impact of
the 4.2% increase in the average euro/£ exchange rate was partially offset by 5.7%
and 7.2% decreases in the average US$/£ and ZAR/£ exchange rates, respectively.
59%, 25% and 4% of the Group’s adjusted operating profit for the 2008 financial
year was denominated in euro, US$ and ZAR, respectively.
On an organic basis, the EMAPA region generated all of the Group’s growth in
adjusted operating profit, with the 20.9% increase in the region driven by a higher
customer base and the resulting increase in service revenue. Europe’s adjusted
operating profit declined by 1.5% on an organic basis compared to the 2007
financial year, resulting from the continuing challenges of highly penetrated
markets, regulatory activity and continued price reductions.
In Europe, adjusted operating profit was stated after a £115 million benefit from the
release of a provision following a revised agreement in Italy relating to the use of
the Vodafone brand and related trademarks, which is offset in common functions,
and was also impacted by higher interconnect, acquisition and retention costs and
the impact of the Group’s increasing focus on fixed line services, including the
acquisition of Tele2 in Italy and Spain.
In the EMAPA region, adjusted operating profit was impacted by the investment
in growing the customer base and the impact of the acquisition in India during the
year and the inclusion of Turkey for a whole year. Both Vodafone Essar and Turkey
generated lower operating profits than the regional average, partially as a result of
the investment in rebranding the businesses to Vodafone, increasing the customer
base and improving network quality in Turkey.
Business acquisitions led to the increase in acquired intangible asset amortisation
and these acquisitions, combined with the continued investment in network
infrastructure, resulted in higher depreciation charges.
The Group’s share of results from associates grew by 5.5%, or 15.1% on an organic
basis. The organic growth was partially offset by a 5.5 percentage point impact
from the disposal of the Group’s interests in Belgacom Mobile S.A. and Swisscom
Mobile A.G. during the 2007 financial year and a 4.1 percentage point impact from
unfavourable exchange rate movements. The organic growth was driven by 24.8%
growth in Verizon Wireless.
Other income and expense for the year ended 31 March 2007 included the
gains on disposal of Belgacom S.A. and Swisscom Mobile A.G., amounting to
£441 million and £68 million, respectively.
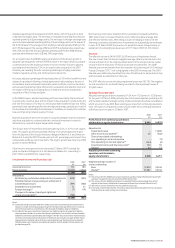
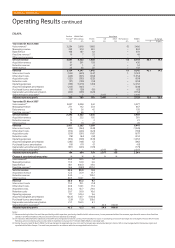
Investment income and financing costs
2008 2007
£m £m
Investment income 714 789
Financing costs (2,014) (1,612)
(1,300) (823)
Analysed as:
Net financing costs before dividends from investments (823) (435)
Potential interest charges arising on settlement of
outstanding tax issues (399) (406)
Dividends from investments 72 57
Foreign exchange(1) (7) (41)
Changes in fair value of equity put rights and
similar arrangements(2) (143) 2
(1,300) (823)
Notes:
(1) Comprises foreign exchange differences reflected in the Consolidated Income Statement in
relation to certain intercompany balances and the foreign exchange differences on financial
instruments received as consideration in the disposal of Vodafone Japan to SoftBank.
(2) Includes the fair value movement in relation to put rights and similar arrangements held by
minority interest holders in certain of the Group’s subsidiaries. The valuation of these financial
liabilities is inherently unpredictable and changes in the fair value could have a material impact
on the future results and financial position of Vodafone. Also includes a charge of £333 million
representing the initial fair value of the put options granted over the Essar Group’s interest in
Vodafone Essar, which has been recorded as an expense. Further details of these options are
provided on page 58.
Net financing costs before dividends from investments increased by 89.2% to
£823 million due to increased financing costs, reflecting higher average debt
and effective interest rates. After taking account of hedging activities, the net
financing costs before dividends from investments are substantially denominated
in euro. At 31 March 2008, the provision for potential interest charges arising on
settlement of outstanding tax issues was £1,577 million (2007: £1,213 million).
Taxation
The effective tax rate is 24.9% (2007: 26.3% exclusive of impairment losses).
The rate is lower than the Group’s weighted average statutory tax rate due to the
structural benefit from the ongoing enhancement of the Group’s internal capital
structure and the resolution of historic issues with tax authorities. The 2008
financial year tax rate benefits from the cessation of provisioning for UK Controlled
Foreign Company (“CFC”) risk as highlighted in the 2007 financial year. The 2007
financial year additionally benefited from one-off additional tax deductions in Italy
and favourable tax settlements in that year.
The 2007 effective tax rate including impairment losses was (101.7)%. The negative
tax rate arose from no tax benefit being recorded for the impairment losses of
£11,600 million.
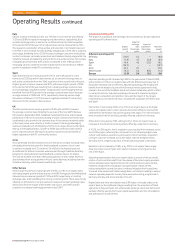
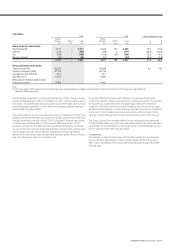
Earnings/(loss) per share
Adjusted earnings per share increased by 11.0% from 11.26 pence to 12.50 pence
for the year to 31 March 2008, primarily due to increased adjusted operating profit
and the lower weighted average number of shares following the share consolidation
which occurred in July 2006. Basic earnings per share from continuing operations
were 12.56 pence compared to a basic loss per share from continuing operations
of 8.94 pence for the year to 31 March 2007.
2008 2007
£m £m
Profit/(loss) from continuing operations
attributable to equity shareholders 6,660 (4,932)
Adjustments:
Impairment losses – 11,600
Other income and expense(1) 28 (502)
Share of associated undertakings’
non-operating income and expense – (3)
Non-operating income and expense(2) (254) (4)
Investment income and financing costs(3) 150 39
Taxation 44 13
Adjusted profit from continuing
operations attributable to
equity shareholders 6,628 6,211
Weighted average number of
shares outstanding
Basic 53,019 55,144
Diluted(4) 53,287 55,144
Notes:
(1) The amount for the 2008 financial year represents a pretax charge offsetting the tax benefit
arising on recognition of a pre-acquisition deferred tax asset.
(2) The amount for the 2008 financial year includes £250 million representing the profit on
disposal of the Group’s 5.60% direct investment in Bharti Airtel Limited (“Bharti Airtel”).
(3) See notes 1 and 2 in investment income and financing costs.
(4) In the year ended 31 March 2007, 215 million shares have been excluded from the calculation
of diluted loss per share as they are not dilutive.
Vodafone Group Plc Annual Report 2008 33