Vodafone 2008 Annual Report Download - page 3
Download and view the complete annual report
Please find page 3 of the 2008 Vodafone annual report below. You can navigate through the pages in the report by either clicking on the pages listed below, or by using the keyword search tool below to find specific information within the annual report.-
 1
1 -
 2
2 -
 3
3 -
 4
4 -
 5
5 -
 6
6 -
 7
7 -
 8
8 -
 9
9 -
 10
10 -
 11
11 -
 12
12 -
 13
13 -
 14
14 -
15
-
16
-
17
-
18
-
19
-
20
-
21
-
22
-
23
-
24
-
25
-
26
-
27
-
28
-
29
-
30
-
31
-
32
-
33
-
34
-
35
-
36
-
37
-
38
-
39
-
40
-
41
-
42
-
43
-
44
-
45
-
46
-
47
-
48
-
49
-
50
-
51
-
52
-
53
-
54
-
55
-
56
-
57
-
58
-
59
-
60
-
61
-
62
-
63
-
64
-
65
-
66
-
67
-
68
-
69
-
70
-
71
-
72
-
73
-
74
-
75
-
76
-
77
-
78
-
79
-
80
-
81
-
82
-
83
-
84
-
85
-
86
-
87
-
88
-
89
-
90
-
91
-
92
-
93
-
94
-
95
-
96
-
97
-
98
-
99
-
100
-
101
-
102
-
103
-
104
-
105
-
106
-
107
-
108
-
109
-
110
-
111
-
112
-
113
-
114
-
115
-
116
-
117
-
118
-
119
-
120
-
121
-
122
-
123
-
124
-
125
-
126
-
127
-
128
-
129
-
130
-
131
-
132
-
133
-
134
-
135
-
136
-
137
-
138
-
139
-
140
-
141
-
142
-
143
-
144
-
145
-
146
-
147
-
148
-
149
-
150
-
151
-
152
-
153
-
154
-
155
-
156
-
157
-
158
-
159
-
160
 |
 |

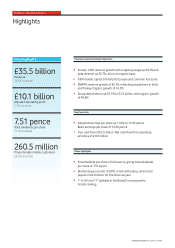
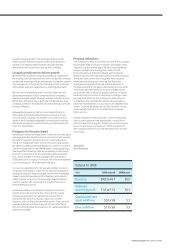
Highlights
Final dividend per share of 5.02 pence, giving total dividends
per share of 7.51 pence
Dividend pay out ratio of 60%, in line with policy, and a total
payout of £4.0 billion for the financial year
1 st in UK and 11th globally in the BrandZ most powerful
brands ranking
•
•
•
Adjusted earnings per share up 11.0% to 12.50 pence.
Basic earnings per share of 12.56 pence
Free cash flow of £5.5 billion. Net cash flow from operating
activities of £10.5 billion
•
•
Key financials
Other highlights
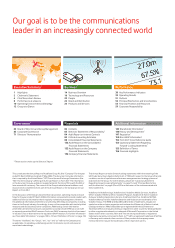
Progress towards strategic objectives
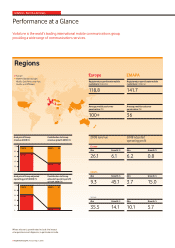
Europe: 2.0% revenue growth with outgoing usage up 20.1% and
data revenue up 35.7%, all on an organic basis
9.9% mobile capital intensity for Europe and common functions
EMAPA: revenue growth of 45.1%, reflecting acquisitions in India
and Turkey. Organic growth of 14.5%
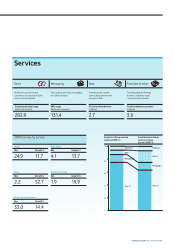
Group data revenue up 52.7% to £2.2 billion, with organic growth
of 40.6%
•
•
•
•
£35.5 billion
Revenue
14.1% increase
£10.1 billion
Adjusted operating profit
5.7% increase
7.51 pence
Total dividends per share
11.1% increase
260.5 million
Proportionate mobile customers
26.2% increase
Group highlights
Vodafone – Executive Summary
Vodafone Group Plc Annual Report 2008 1