Vodafone 2008 Annual Report Download - page 53
Download and view the complete annual report
Please find page 53 of the 2008 Vodafone annual report below. You can navigate through the pages in the report by either clicking on the pages listed below, or by using the keyword search tool below to find specific information within the annual report.-
 1
1 -
2
-
3
-
4
-
5
-
6
-
7
-
8
-
9
-
10
-
11
-
12
-
13
-
14
-
15
-
16
-
17
-
18
-
19
-
20
-
21
-
22
-
23
-
24
-
25
-
26
-
27
-
28
-
29
-
30
-
31
-
32
-
33
-
34
-
35
-
36
-
37
-
38
-
39
-
40
-
41
-
42
-
 43
43 -
 44
44 -
 45
45 -
 46
46 -
 47
47 -
 48
48 -
 49
49 -
 50
50 -
 51
51 -
 52
52 -
 53
53 -
 54
54 -
 55
55 -
 56
56 -
 57
57 -
 58
58 -
 59
59 -
 60
60 -
 61
61 -
 62
62 -
 63
63 -
64
-
65
-
66
-
67
-
68
-
69
-
70
-
71
-
72
-
73
-
74
-
75
-
76
-
77
-
78
-
79
-
80
-
81
-
82
-
83
-
84
-
85
-
86
-
87
-
88
-
89
-
90
-
91
-
92
-
93
-
94
-
95
-
96
-
97
-
98
-
99
-
100
-
101
-
102
-
103
-
104
-
105
-
106
-
107
-
108
-
109
-
110
-
111
-
112
-
113
-
114
-
115
-
116
-
117
-
118
-
119
-
120
-
121
-
122
-
123
-
124
-
125
-
126
-
127
-
128
-
129
-
130
-
131
-
132
-
133
-
134
-
135
-
136
-
137
-
138
-
139
-
140
-
141
-
142
-
143
-
144
-
145
-
146
-
147
-
148
-
149
-
150
-
151
-
152
-
153
-
154
-
155
-
156
-
157
-
158
-
159
-
160
 |
 |

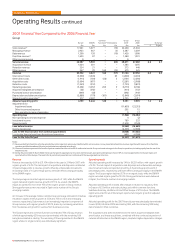
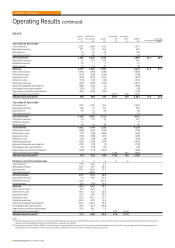
Outlook
2009 financial year
Adjusted Capitalised
operating fixed asset Free
Revenue profit additions cash flow
£bn £bn £bn £bn
2008 performance 35.5 10.1 5.1 5.5(1)
2009 outlook(2)(3) 39.8 to 40.7 11.0 to 11.5 5.3 to 5.8 5.1 to 5.6(4)
Notes:
(1) The amount for the 2008 financial year includes £0.4 billion benefit from deferred payments
for capital expenditure but is stated after £0.7 billion of tax payments, including associated
interest, in respect of a number of long standing tax issues.
(2) Includes assumption of average foreign exchange rates for the 2009 financial year of
approximately £1:€1.30 (2008: 1.42) and £1:US$1.96 (2008: 2.01). A substantial majority
of the Group’s revenue, adjusted operating profit, capitalised fixed asset additions and free
cash flow is denominated in currencies other than sterling, the Group’s reporting currency.
A 1% change in the euro to sterling exchange rate would impact revenue by approximately
£250 million and adjusted operating profit by approximately £70 million.
(3) The outlook does not include the impact of a change in the Group’s effective interest in
Neuf Cegetel.
(4) Excludes spectrum and licence payments, but includes estimated payments in respect of
long standing tax issues.
The outlook ranges reflect the Group’s assumptions for average foreign exchange
rates for the 2009 financial year. In respect of the euro to sterling exchange rate,
this represents an approximate 10% change to the 2008 financial year, resulting
in favourable year on year increases in revenue, adjusted operating profit and free
cash flow and adverse changes in capitalised fixed asset additions.
Operating conditions are expected to continue to be challenging in Europe given
the current economic environment and ongoing pricing and regulatory pressures
but with continued positive trends in messaging and data revenue and voice
usage growth. Increasing market penetration is expected to continue to result
in overall strong growth for the EMAPA region. The Group considers that its
geographically diverse portfolio should provide some resilience in the current
economic environment.
Revenue is expected to be in the range of £39.8 billion to £40.7 billion. The Group
continues to drive revenue growth, particularly in respect of its total communications
strategy for data and fixed broadband services and in emerging markets. Revenue
includes the first full year post acquisition of Vodafone Essar in India and the Tele2
businesses in Italy and Spain.
Adjusted operating profit is expected to be in the range of £11.0 billion to
£11.5 billion. The Group margin is expected to decline by a similar amount as
in the 2008 financial year but with a greater impact from lower margin fixed
broadband services. Verizon Wireless, the Group’s US associate, is expected to
continue to perform strongly.
Total depreciation and amortisation charges are anticipated to be around
£6.5 billion to £6.6 billion, higher than the 2008 financial year, primarily as a
result of the ongoing investment in capital expenditure in India and the impact
of changes in foreign exchange rates.
The Group expects capitalised fixed asset additions to be in the range of
£5.3 billion to £5.8 billion, including an increase in investment in India. Capitalised
fixed asset additions are anticipated to be around 10% of revenue for the total of
the Europe region and common functions, with continued investment in growth.
Free cash flow is expected to be in the range of £5.1 billion to £5.6 billion, excluding
spectrum and licence payments. This is after taking into account £0.3 billion from
payments for capital expenditure deferred from the 2008 financial year.
The Group will invest £0.2 billion in Qatar in respect of the second mobile licence
won in December 2007. During the 2009 financial year, Vodafone Qatar is expected
to pay £1.0 billion for the licence with the balance of the funding being provided
by the other shareholders in Vodafone Qatar.
The Group continues to make significant cash payments for tax and associated
interest in respect of long standing tax issues. The Group does not expect
resolution of the application of the UK Controlled Foreign Company legislation
to the Group in the near term.
The adjusted effective tax rate percentage is expected to be in the high 20s for
the 2009 financial year, with the Group targeting the high 20s in the medium term.
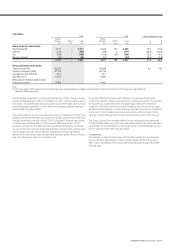
2008 financial year
Capitalised
Adjusted fixed
operating asset Free
Revenue profit additions cash flow(1)
£bn £bn £bn £bn
Outlook – May 2007(2) 33.3 to 34.1 9.3 to 9.9 4.7 to 5.1 4.0 to 4.5
Outlook – November 2007(3) 34.5 to 35.1 9.5 to 9.9 4.7 to 5.1 4.4 to 4.9
Foreign exchange(4) 0.7 0.1 0.1 0.1
Adjusted outlook(5) 35.2 to 35.8 9.6 to 10.0 4.8 to 5.2 4.5 to 5.0
2008 performance 35.5 10.1 5.1 5.5
Notes:
(1) The amount for the 2008 financial year includes £0.4 billion benefit from deferred payments
for capital expenditure but is stated after £0.7 billion of tax payments, including associated
interest, in respect of a number of long standing tax issues.
(2) The Group’s outlook from May 2007 reflected expectations for average foreign exchange
rates for the 2008 financial year of approximately £1:€1.47 and £1:US$1.98.
(3) The Group’s outlook, as updated in November 2007, reflected improvements in operational
performance, the impact of the Tele2 acquisition and updated expectations for average
foreign exchange rates for the 2008 financial year of approximately £1:€1.45 and £1:US$2.04.
(4) These amounts represent the difference between the forecast exchange rates used in the
November 2007 update and rates used to translate actual results including £1:€1.42 and
£1:US$2.01.
(5) Outlook from November 2007 adjusted solely for exchange rate differences as discussed in
note 4 above.
Vodafone Group Plc Annual Report 2008 51