Vodafone 2008 Annual Report Download - page 121
Download and view the complete annual report
Please find page 121 of the 2008 Vodafone annual report below. You can navigate through the pages in the report by either clicking on the pages listed below, or by using the keyword search tool below to find specific information within the annual report.-
 1
1 -
2
-
3
-
4
-
5
-
6
-
7
-
8
-
9
-
10
-
11
-
12
-
13
-
14
-
15
-
16
-
17
-
18
-
19
-
20
-
21
-
22
-
23
-
24
-
25
-
26
-
27
-
28
-
29
-
30
-
31
-
32
-
33
-
34
-
35
-
36
-
37
-
38
-
39
-
40
-
41
-
42
-
43
-
44
-
45
-
46
-
47
-
48
-
49
-
50
-
51
-
52
-
53
-
54
-
55
-
56
-
57
-
58
-
59
-
60
-
61
-
62
-
63
-
64
-
65
-
66
-
67
-
68
-
69
-
70
-
71
-
72
-
73
-
74
-
75
-
76
-
77
-
78
-
79
-
80
-
81
-
82
-
83
-
84
-
85
-
86
-
87
-
88
-
89
-
90
-
91
-
92
-
93
-
94
-
95
-
96
-
97
-
98
-
99
-
100
-
101
-
102
-
103
-
104
-
105
-
106
-
107
-
108
-
109
-
110
-
 111
111 -
 112
112 -
 113
113 -
 114
114 -
 115
115 -
 116
116 -
 117
117 -
 118
118 -
 119
119 -
 120
120 -
 121
121 -
 122
122 -
 123
123 -
 124
124 -
 125
125 -
 126
126 -
 127
127 -
 128
128 -
 129
129 -
 130
130 -
 131
131 -
132
-
133
-
134
-
135
-
136
-
137
-
138
-
139
-
140
-
141
-
142
-
143
-
144
-
145
-
146
-
147
-
148
-
149
-
150
-
151
-
152
-
153
-
154
-
155
-
156
-
157
-
158
-
159
-
160
 |
 |
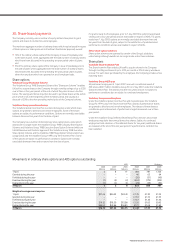
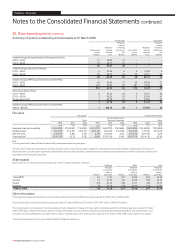
Bank loans also include INR66 billion of loans held by Vodafone Essar Limited (“VEL”) and its subsidiaries (the “VEL Group”, a total of eight legal entities), which form the
operating companies in India. The VEL Group has a number of security arrangements supporting its secured loan obligations comprising its physical assets and certain
share pledges of the shares under VEL. The terms and conditions of the security arrangements mean that should members of the VEL Group not meet all of their loan
payment and performance obligations, the lenders may sell the pledged shares and/or assets to recover their losses, with any remaining sales proceeds being
returned to the VEL Group. Six of the eight legal entities provide cross guarantees to the lenders.
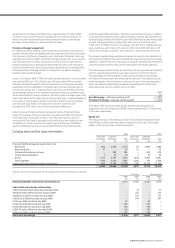
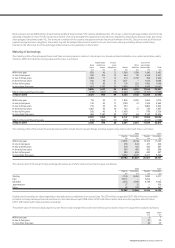
Maturity of borrowings
The maturity profile of the anticipated future cash flows including interest in relation to the Group’s non-derivative financial liabilities on an undiscounted basis, which,
therefore, differs from both the carrying value and fair value, is as follows:
Redeemable Finance Loans in fair
Bank preference lease Other value hedge
loans shares obligations Bonds liabilities relationships Total
£m £m £m £m £m £m £m
Within one year 838 43 12 1,368 1,788 1,443 5,492
In one to two years 369 104 12 464 110 4,168 5,227
In two to three years 1,490 77 12 214 2,732 398 4,923
In three to four years 346 43 12 1,671 – 1,016 3,088
In four to five years 142 43 11 139 223 1,082 1,640
In more than five years 423 1,132 26 2,990 137 9,459 14,167
3,608 1,442 85 6,846 4,990 17,566 34,537
Effect of discount/financing rates (133) (457) (16) (1,282) (258) (5,197) (7,343)
31 March 2008 3,475 985 69 5,564 4,732 12,369 27,194
Within one year 116 43 11 1,853 2,225 1,464 5,712
In one to two years 142 43 11 1,100 21 1,346 2,663
In two to three years 153 43 10 334 – 3,802 4,342
In three to four years 1,265 43 10 123 51 355 1,847
In four to five years 265 43 9 1,430 – 979 2,726
In more than five years 384 1,187 32 1,707 84 9,140 12,534
2,325 1,402 83 6,547 2,381 17,086 29,824
Effect of discount/financing rates (145) (584) (17) (946) – (5,517) (7,209)
31 March 2007 2,180 818 66 5,601 2,381 11,569 22,615
The maturity profile of the Group’s financial derivatives (which include interest rate and foreign exchange swaps), using undiscounted cash flows, is as follows:
2008 2007
Payable Receivable Payable Receivable
£m £m £m £m
Within one year 14,931 14,749 15,163 15,163
In one to two years 433 644 611 626
In two to three years 378 441 503 587
In three to four years 399 430 403 398
In four to five years 380 406 400 387
In more than five years 3,662 4,637 3,577 3,596
20,183 21,307 20,657 20,757
The currency split of the Group’s foreign exchange derivatives, all of which mature in less than one year, is as follows:
2008 2007
Payable Receivable Payable Receivable
£m £m £m £m
Sterling 2,126 8,262 1,000 5,477
Euro 10,111 – 7,204 –
US dollar 2,076 4,992 6,178 8,166
Japanese yen 27 15 – 106
Other 42 797 84 747
14,382 14,066 14,466 14,496
Payables and receivables are stated separately in the table above as settlement is on a gross basis. The £316 million net payable (2007: £30 million net receivable)
in relation to foreign exchange financial instruments in the table above is split £358 million (2007: £48 million) within trade and other payables and £42 million
(2007: £78 million) within trade and other receivables.
The present value of minimum lease payments under finance lease arrangements under which the Group has leased certain of its equipment is analysed as follows:
2008 2007
£m £m
Within one year 9 7
In two to five years 37 30
In more than five years 24 29
Vodafone Group Plc Annual Report 2008 119