Vodafone 2008 Annual Report Download - page 36
Download and view the complete annual report
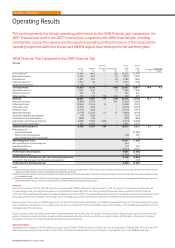
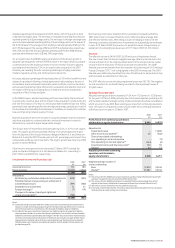
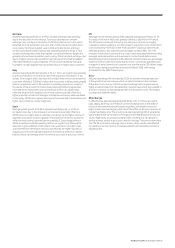
Please find page 36 of the 2008 Vodafone annual report below. You can navigate through the pages in the report by either clicking on the pages listed below, or by using the keyword search tool below to find specific information within the annual report.-
 1
1 -
2
-
3
-
4
-
5
-
6
-
7
-
8
-
9
-
10
-
11
-
12
-
13
-
14
-
15
-
16
-
17
-
18
-
19
-
20
-
21
-
22
-
23
-
24
-
25
-
 26
26 -
 27
27 -
 28
28 -
 29
29 -
 30
30 -
 31
31 -
 32
32 -
 33
33 -
 34
34 -
 35
35 -
 36
36 -
 37
37 -
 38
38 -
 39
39 -
 40
40 -
 41
41 -
 42
42 -
 43
43 -
 44
44 -
 45
45 -
 46
46 -
47
-
48
-
49
-
50
-
51
-
52
-
53
-
54
-
55
-
56
-
57
-
58
-
59
-
60
-
61
-
62
-
63
-
64
-
65
-
66
-
67
-
68
-
69
-
70
-
71
-
72
-
73
-
74
-
75
-
76
-
77
-
78
-
79
-
80
-
81
-
82
-
83
-
84
-
85
-
86
-
87
-
88
-
89
-
90
-
91
-
92
-
93
-
94
-
95
-
96
-
97
-
98
-
99
-
100
-
101
-
102
-
103
-
104
-
105
-
106
-
107
-
108
-
109
-
110
-
111
-
112
-
113
-
114
-
115
-
116
-
117
-
118
-
119
-
120
-
121
-
122
-
123
-
124
-
125
-
126
-
127
-
128
-
129
-
130
-
131
-
132
-
133
-
134
-
135
-
136
-
137
-
138
-
139
-
140
-
141
-
142
-
143
-
144
-
145
-
146
-
147
-
148
-
149
-
150
-
151
-
152
-
153
-
154
-
155
-
156
-
157
-
158
-
159
-
160
 |
 |

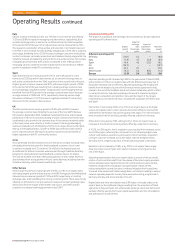
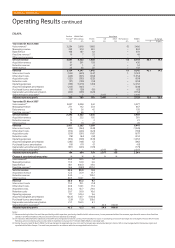
Operating Results continued
Europe
Germany Italy Spain UK Arcor Other Eliminations Europe % change
£m £m £m £m £m £m £m £m £ Organic
Year ended 31 March 2008
Voice revenue(1) 3,791 3,169 3,792 3,601 10 3,408 (286) 17,485
Messaging revenue 710 689 425 923 1 547 (33) 3,262
Data revenue 583 274 341 383 – 291 (45) 1,827
Fixed line revenue(1) 21 137 86 24 1,596 49 (86) 1,827
Other service revenue 2 4 2 21 – – – 29
Service revenue 5,107 4,273 4,646 4,952 1,607 4,295 (450) 24,430 6.3 2.1
Acquisition revenue 178 129 268 300 25 142 (3) 1,039
Retention revenue 43 27 143 46 – 96 – 355
Other revenue 69 6 6 126 – 50 – 257
Revenue 5,397 4,435 5,063 5,424 1,632 4,583 (453) 26,081 6.1 2.0
Interconnect costs (593) (725) (719) (1,121) (382) (854) 414 (3,980)
Other direct costs (312) (238) (418) (484) (353) (283) 24 (2,064)
Acquisition costs (627) (325) (620) (766) (166) (378) 10 (2,872)
Retention costs (384) (106) (536) (389) – (341) – (1,756)
Operating expenses (1,139) (883) (964) (1,233) (406) (1,099) 5 (5,719)
Acquired intangibles amortisation – (31) (14) (22) – (11) – (78)
Purchased licence amortisation (354) (80) (6) (333) – (73) – (846)
Depreciation and other amortisation (723) (474) (504) (645) (100) (539) – (2,985)
Share of result in associates(2) – – – – – 425 – 425
Adjusted operating profit 1,265 1,573 1,282 431 225 1,430 – 6,206 0.8 (1.5)
Year ended 31 March 2007
Voice revenue(1) 3,981 3,307 3,415 3,604 – 3,297 (343) 17,261
Messaging revenue 746 563 380 760 – 501 (25) 2,925
Data revenue 413 189 247 295 – 194 (38) 1,300
Fixed line revenue(1) 15 22 20 17 1,419 26 (26) 1,493
Other service revenue 1 2 – 5 – – – 8
Service revenue 5,156 4,083 4,062 4,681 1,419 4,018 (432) 22,987
Acquisition revenue 172 124 307 274 22 108 (3) 1,004
Retention revenue 40 36 124 52 – 102 – 354
Other revenue 75 2 7 117 – 47 (1) 247
Revenue 5,443 4,245 4,500 5,124 1,441 4,275 (436) 24,592
Interconnect costs (645) (628) (675) (1,001) (338) (813) 432 (3,668)
Other direct costs (332) (242) (352) (452) (262) (275) 1 (1,914)
Acquisition costs (560) (249) (642) (677) (178) (301) 3 (2,604)
Retention costs (351) (107) (398) (372) – (315) – (1,543)
Operating expenses (1,126) (870) (866) (1,163) (396) (1,041) – (5,462)
Acquired intangibles amortisation – – – (11) – (11) – (22)
Purchased licence amortisation (340) (75) (37) (333) – (64) – (849)
Depreciation and other amortisation (735) (499) (430) (604) (96) (524) – (2,888)
Share of result in associates(2) – – – – – 517 – 517
Adjusted operating profit 1,354 1,575 1,100 511 171 1,448 – 6,159
Change at constant exchange rates % % % % % %
Voice revenue(1) (8.3) (7.9) 6.6 (0.1) – (0.6)
Messaging revenue (8.7) 17.2 7.3 21.4 – 4.7
Data revenue 34.7 38.8 32.2 29.8 – 44.0
Fixed line revenue(1) 38.6 489.7 318.5 41.2 7.7 73.0
Other service revenue 63.6 104.8 – 320.0 – –
Service revenue (4.8) 0.6 9.7 5.8 8.5 2.7
Acquisition revenue (0.4) (0.5) (15.5) 9.5 9.1 26.9
Retention revenue 0.9 (27.0) 10.9 (11.5) – (9.0)
Other revenue (10.2) 250.0 (22.7) 7.7 – 2.1
Revenue (4.7) 0.4 8.0 5.9 8.5 3.0
Interconnect costs (11.2) 10.9 2.4 12.0 8.7 0.8
Other direct costs (10.1) (6.1) 13.6 7.1 27.2 (2.2)
Acquisition costs 7.6 24.5 (7.1) 13.1 (10.0) 21.0
Retention costs 5.1 (3.4) 28.7 4.6 – 3.8
Operating expenses (2.7) (2.6) 6.8 6.0 (1.1) 1.3
Acquired intangibles amortisation – – – 100.0 – –
Purchased licence amortisation – 2.6 (88.9) – – 9.0
Depreciation and other amortisation (6.0) (8.8) 16.1 6.8 (1.0) (0.7)
Share of result in associates(2) – – – – – (20.7)
Adjusted operating profit (10.1) (3.8) 12.2 (15.7) 25.5 (4.7)
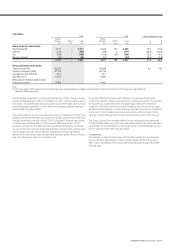
Notes:
(1) Revenue relating to fixed line activities provided by mobile operators, previously classified within voice revenue, is now presented as fixed line revenue, together with revenue from fixed line
operators and fixed broadband. All prior periods have been adjusted accordingly.
(2) During the year ended 31 March 2008, the Group changed its organisational structure and the Group’s associated undertaking in France, SFR, is now managed within the Europe region and
reported within Other Europe. The results are presented in accordance with the new organisational structure.
34 Vodafone Group Plc Annual Report 2008
Vodafone – Performance