Vodafone 2008 Annual Report Download - page 82
Download and view the complete annual report
Please find page 82 of the 2008 Vodafone annual report below. You can navigate through the pages in the report by either clicking on the pages listed below, or by using the keyword search tool below to find specific information within the annual report.-
 1
1 -
2
-
3
-
4
-
5
-
6
-
7
-
8
-
9
-
10
-
11
-
12
-
13
-
14
-
15
-
16
-
17
-
18
-
19
-
20
-
21
-
22
-
23
-
24
-
25
-
26
-
27
-
28
-
29
-
30
-
31
-
32
-
33
-
34
-
35
-
36
-
37
-
38
-
39
-
40
-
41
-
42
-
43
-
44
-
45
-
46
-
47
-
48
-
49
-
50
-
51
-
52
-
53
-
54
-
55
-
56
-
57
-
58
-
59
-
60
-
61
-
62
-
63
-
64
-
65
-
66
-
67
-
68
-
69
-
70
-
71
-
 72
72 -
 73
73 -
 74
74 -
 75
75 -
 76
76 -
 77
77 -
 78
78 -
 79
79 -
 80
80 -
 81
81 -
 82
82 -
 83
83 -
 84
84 -
 85
85 -
 86
86 -
 87
87 -
 88
88 -
 89
89 -
 90
90 -
 91
91 -
 92
92 -
93
-
94
-
95
-
96
-
97
-
98
-
99
-
100
-
101
-
102
-
103
-
104
-
105
-
106
-
107
-
108
-
109
-
110
-
111
-
112
-
113
-
114
-
115
-
116
-
117
-
118
-
119
-
120
-
121
-
122
-
123
-
124
-
125
-
126
-
127
-
128
-
129
-
130
-
131
-
132
-
133
-
134
-
135
-
136
-
137
-
138
-
139
-
140
-
141
-
142
-
143
-
144
-
145
-
146
-
147
-
148
-
149
-
150
-
151
-
152
-
153
-
154
-
155
-
156
-
157
-
158
-
159
-
160
 |
 |

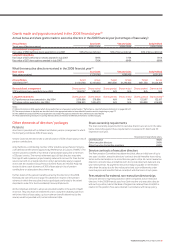
Further details of the options outstanding at 31 March 2008 as disclosed on the previous page are as follows:
Exercisable Exercisable
Market price greater than Option price greater than
option price(1) market price(1) Not yet exercisable
Weighted Weighted Weighted
average average average
Options exercise Latest Options exercise Latest Options exercise Latest
held price expiry held price expiry held price expiry
Number Pence date Number Pence date Number Pence date
Arun Sarin 10,915,924 119.2 July 2014 – – – 19,756,105 139.6 July 2017
Vittorio Colao – – – – – – 6,476,550 150.5 July 2017
Andy Halford 554,585 114.2 July 2014 344,800 214.6 July 2011 7,164,190 139.6 July 2017
Note:
(1) Market price is the closing middle market price of the Company’s ordinary shares at 31 March 2008 of 150.9 pence. During the year, the share price moved between a high of 197.5 pence and a low
of 137.5 pence.
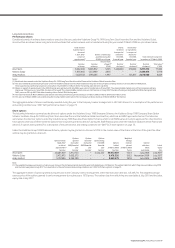
The Company’s register of directors’ interests (which is open to inspection) contains full details of directors’ shareholdings and options to subscribe. These options by
exercise price were:
Options Options Options Options
held at granted exercised lapsed
1 April 2007 during the during the during the Options
Option or date of 2008 2008 2008 held at
price appointment financial year financial year financial year 31 March 2008
Pence Number Number Number Number Number
Vodafone Group 1998 Executive Share Option Scheme (Unapproved) 255.00 114,000 – – – 114,000
282.30 66,700 – – – 66,700
Vodafone Group 1998 Company Share Option Scheme (Approved) 255.00 11,500 – – – 11,500
282.30 200 – – – 200
Vodafone Group 1998 Sharesave Scheme 95.30 16,710 – – – 16,710
91.64 10,202 – – – 10,202
Vodafone Group Plc 1999 Long Term Stock Incentive Plan(1) 151.56 152,400 – – – 152,400
90.00 94,444 – – – 94,444
119.25 7,612,787 – – – 7,612 ,787
119.00 7,285,631 – – 3,522,353 3,763,278
145.25 7,507,295 – – – 7,507,295
Vodafone Group Plc Global Incentive Plan(1) 115.25 11,177,746 – – – 11,177,746
135.50 3,472,975 – – – 3,472,975
167.80 – 11,211,917 – – 11,211,917
37,522,590 11,211,917 – 3,522,353 45,212,154
Note:
(1) The Vodafone Group Plc 1999 Long Term Stock Incentive Plan and Vodafone Group Plc Global Incentive Plan are both HMRC approved. However, note that the actual awards made under these
plans may be approved or unapproved.
80 Vodafone Group Plc Annual Report 2008
Vodafone – Governance
Directors’ Remuneration continued