Vodafone 2008 Annual Report Download - page 41
Download and view the complete annual report
Please find page 41 of the 2008 Vodafone annual report below. You can navigate through the pages in the report by either clicking on the pages listed below, or by using the keyword search tool below to find specific information within the annual report.-
 1
1 -
2
-
3
-
4
-
5
-
6
-
7
-
8
-
9
-
10
-
11
-
12
-
13
-
14
-
15
-
16
-
17
-
18
-
19
-
20
-
21
-
22
-
23
-
24
-
25
-
26
-
27
-
28
-
29
-
30
-
 31
31 -
 32
32 -
 33
33 -
 34
34 -
 35
35 -
 36
36 -
 37
37 -
 38
38 -
 39
39 -
 40
40 -
 41
41 -
 42
42 -
 43
43 -
 44
44 -
 45
45 -
 46
46 -
 47
47 -
 48
48 -
 49
49 -
 50
50 -
 51
51 -
52
-
53
-
54
-
55
-
56
-
57
-
58
-
59
-
60
-
61
-
62
-
63
-
64
-
65
-
66
-
67
-
68
-
69
-
70
-
71
-
72
-
73
-
74
-
75
-
76
-
77
-
78
-
79
-
80
-
81
-
82
-
83
-
84
-
85
-
86
-
87
-
88
-
89
-
90
-
91
-
92
-
93
-
94
-
95
-
96
-
97
-
98
-
99
-
100
-
101
-
102
-
103
-
104
-
105
-
106
-
107
-
108
-
109
-
110
-
111
-
112
-
113
-
114
-
115
-
116
-
117
-
118
-
119
-
120
-
121
-
122
-
123
-
124
-
125
-
126
-
127
-
128
-
129
-
130
-
131
-
132
-
133
-
134
-
135
-
136
-
137
-
138
-
139
-
140
-
141
-
142
-
143
-
144
-
145
-
146
-
147
-
148
-
149
-
150
-
151
-
152
-
153
-
154
-
155
-
156
-
157
-
158
-
159
-
160
 |
 |

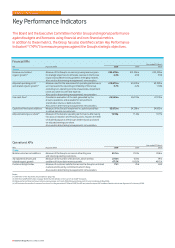
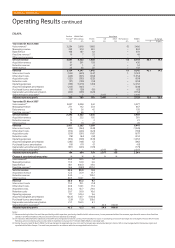
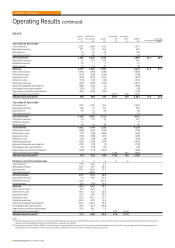
Mobile telecommunications KPIs
2008 2007
Eastern Middle East, Eastern Middle East,
Europe Africa & Asia Pacific EMAPA Europe Africa & Asia Pacific EMAPA
Closing customers (’000) 33,547 79,289 6,279 119,115 28,975 27,160 5,750 61,885
Closing 3G devices (’000) 686 885 1,297 2,868 347 367 778 1,492
Voice usage (millions of minutes) 48,431 189,747 12,845 251,023 39,658 37,449 11,371 88,478
See page 155 for definition of terms
Vodafone has continued to execute on its strategy to deliver strong growth in
emerging markets during the 2008 financial year, with the acquisition of Vodafone
Essar (formerly Hutchison Essar) in India and with strong performances in Turkey,
acquired in May 2006, Romania and Egypt. The Group is beginning to differentiate
itself in its emerging markets, with initiatives such as the introduction of Vodafone
branded handsets and the Vodafone M-PESA/Vodafone Money Transfer service.
On 8 May 2007, the Group continued to successfully increase its portfolio in
emerging markets by acquiring companies with interests in Vodafone Essar,
a leading operator in the fast growing Indian mobile market, following which
the Group controls Vodafone Essar. The business was rebranded to Vodafone
in September 2007.
In conjunction with the Vodafone Essar acquisition, the Group signed a
memorandum of understanding with Bharti Airtel, the Group’s former joint
venture in India, on infrastructure sharing and granted an option to a Bharti
group company to buy its 5.60% direct interest in Bharti Airtel, which was
exercised on 9 May 2007.
An initial public offering of 25% of Safaricom shares held by the Government of
Kenya closed to applicants on 23 April 2008. Share allocations are expected
to be announced on, or around, 30 May 2008, following which Safaricom will be
accounted for as an associate, rather than as a joint venture. The Group’s effective
equity interest will remain unchanged.
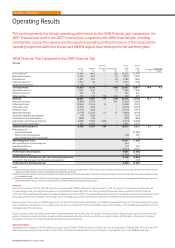
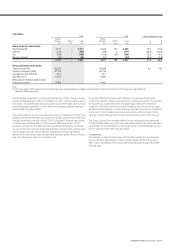
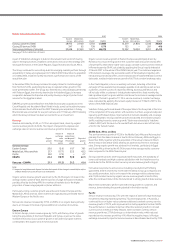
Revenue
Revenue growth for the year ended 31 March 2008 was 45.1% for the region,
or 14.5% on an organic basis, with the key driver for organic growth being the
increase in service revenue of 46.1%, or 14.4% on an organic basis. The impact of
acquisitions, disposal and foreign exchange movements on service revenue and
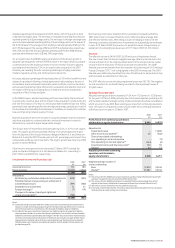
revenue growth are shown below:
Impact of Impact of
exchange acquisitions
Organic rates and disposal(1) Reported
growth Percentage Percentage growth
% points points %
Service revenue
Eastern Europe 9.7 6.9 10.5 27.1
Middle East, Africa and Asia 22.3 (7.6) 66.3 81.0
Pacific 8.6 8.3 – 16.9
EMAPA 14.4 3.4 28.3 46.1
Revenue – EMAPA 14.5 3.1 27.5 45.1
Note:
(1) Impact of acquisitions and disposal includes the impact of the change in consolidation status
of Bharti Airtel from a joint venture to an investment in February 2007.
On an organic basis, voice revenue grew by 12.8% and messaging revenue and
data revenue rose by 6.5% and 87.9%, respectively, as a result of the 26.2%
organic increase in the average customer base, driven primarily by increasing
penetration in emerging markets. Strong performances in Turkey, Egypt, Romania
and India contributed to the growth in service revenue.
Eastern Europe
In Eastern Europe, service revenue increased by 27.1%, or 9.7% on an organic
basis, driven by the acquisition of Turkey in the 2007 financial year and a good
performance in Romania.
At constant exchange rates, Turkey delivered revenue growth of 24%, assuming
the Group owned the business for the whole of both periods, with 25.2% growth
in the average customer base compared to the 2007 financial year. While growth
rates remained high, they slowed in the last quarter of the year, but remained
consistent with the overall growth rate for the market. In order to maintain
momentum in an increasingly competitive environment, the business is
concentrating on targeted promotional offers and focusing on developing
distribution, as well as continued investment in the brand and completing the
planned improvements to network coverage. The revenue performance year on
year was principally as a result of the increase in voice revenue driven by the rise
in average customers, but also benefited from the growth in messaging revenue,
resulting from higher volumes.
In Romania, service revenue increased by 15.0%, or 19.6% at constant exchange
rates, driven by an 18.3% rise in the average customer base following the impact
of initiatives focusing on business and contract customers, as well as growth
in roaming revenue and a strong performance in data revenue, which grew by
92.6%, or 97.7% at constant exchange rates, to £41 million following successful
promotions and a growing base of mobile data customers. However, service
revenue growth slowed in the last quarter, when compared to the same quarter
in the 2007 financial year, in line with lower average customer growth, which is
in turn driven by increased competition in the market, with five mobile operators
now competing for market share.
Middle East, Africa and Asia
Service revenue growth in Middle East, Africa and Asia increased by 81.0%, or
22.3% on an organic basis, with the acquisition of Vodafone Essar being the main
reason for the difference between reported and organic growth. The growth
in organic service revenue was as a result of strong performances in Egypt,
Vodacom and Safaricom, the Group’s joint venture in Kenya.
At constant exchange rates, Vodafone Essar has performed well since acquisition,
with growth in revenue of 55% assuming the Group owned the business for the
whole of both periods. Since acquisition, there have been 16.4 million net customer
additions, bringing the total customer base to 44.1 million at 31 March 2008.
Penetration in mobile telephony increased following falling prices of both handsets
and tariffs and network coverage increases. The market remains competitive with
prepaid offerings moving to lifetime validity products, which allow the customer
to stay connected to the network without requiring any top ups, following price
reductions in the market. Revenue continues to grow as the customer base
increases, particularly in outgoing voice as service offerings drive greater usage.
In Egypt, service revenue growth was 27.1%, or 31.2% at constant exchange rates,
benefiting from a 52.7% increase in the average customer base and an increase in
voice revenue, with the fall in the effective rate per minute being offset by a 60.1%
increase in usage. The success of recent prepaid customer offerings, such as the
Vodafone Family tariff, contributed to the 45.8% growth in closing customers
compared to the 2007 financial year.
Vodafone Group Plc Annual Report 2008 39